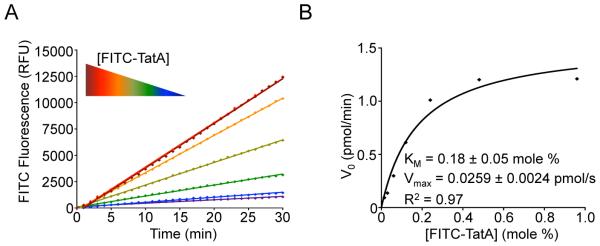
Figure 5.
Kinetic analysis of membrane-immersed proteolysis. (A) Real-time reaction time courses showing an increase in reaction rate with increasing substrate concentration. Note that the two highest concentrations of substrate (black and red points/lines overlay, indicating enzyme saturation by substrate). (B) A plot of initial velocities against FITC-TatA substrate concentration (in mole percent) is modeled well by a Michaelis-Menten enzyme kinetics model, allowing KM and Vmax kinetic constants to be extracted for GlpG intramembrane proteolysis.

