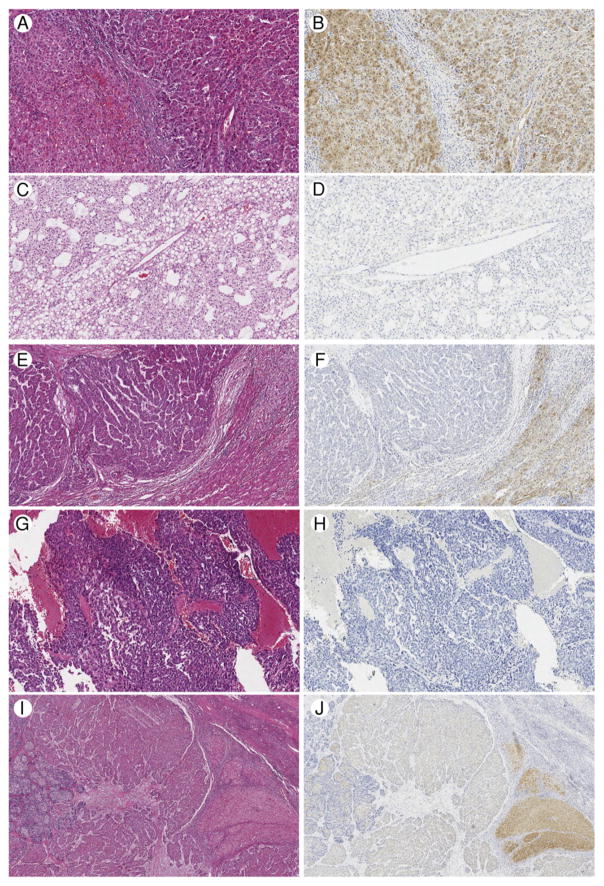
Fig. 2.
Spectrum of LFABP staining. A, Case 4, uninvolved hepatic parenchyma on left with well-differentiated hepatocellular carcinoma (HCC) on right, hematoxylin and eosin (H&E), ×100. B, Case 4, diffuse, strong LFABP staining in uninvolved hepatic parenchyma and HCC, ×100. C, Case 11, representative area of well to moderately differentiated HCC, H&E, ×100. D, Case 11, complete loss of LFABP staining, ×100. E, Case 16, moderately differentiated HCC on left, uninvolved hepatic parenchyma on right, H&E, ×100. F, Case 16, complete loss of LFABP staining in HCC with diffuse, strong LFABP staining in uninvolved hepatic parenchyma, ×100. G, Case 20, representative area of poorly differentiated HCC, H&E, ×100. H, Case 20, complete loss of LFABP staining, ×100. I, Case 17, Moderately to poorly differentiated HCC, H&E, ×40. J, Case 17, patchy, variably intense LFABP staining, ×40. A small portion of uninvolved hepatic parenchyma is seen at the right, with the most intense staining for LFABP.

