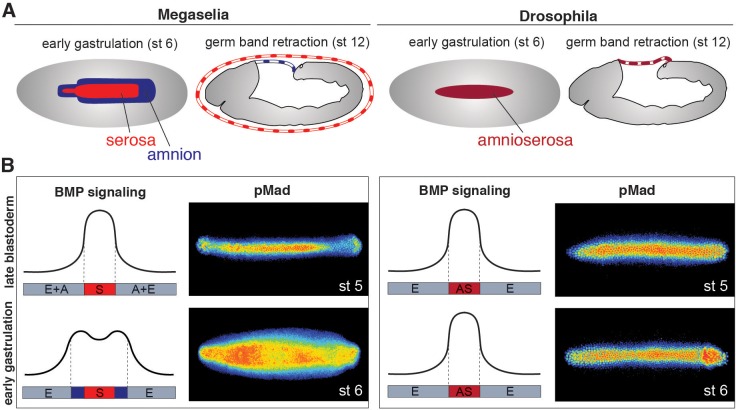
Figure 1. Extraembryonic tissue and BMP signaling differ between Megaselia and Drosophila.
(A) Schematics of Megaselia embryos with serosa and amnion and of Drosophila embryos with amnioserosa at the beginning of gastrulation (stage 6, left) and during early germ band retraction (stage 12, right), modified from Rafiqi et al. (2012). Here, as in all subsequent figures, blastoderm and gastrula stages are shown in dorsal view while later stages are shown in lateral view with the dorsal side up unless specified otherwise. Anterior is always left. (B) Schematic pMad intensity profiles at the dorsal midline relative to prospective serosa (S, red), amnion (A, blue), amnioserosa (AS, maroon), and embryonic tissues (E, grey) in Megaselia and Drosophila. Representative embryos stained for pMad on right.

