. 2016 Dec 22;5:e20894. doi: 10.7554/eLife.20894

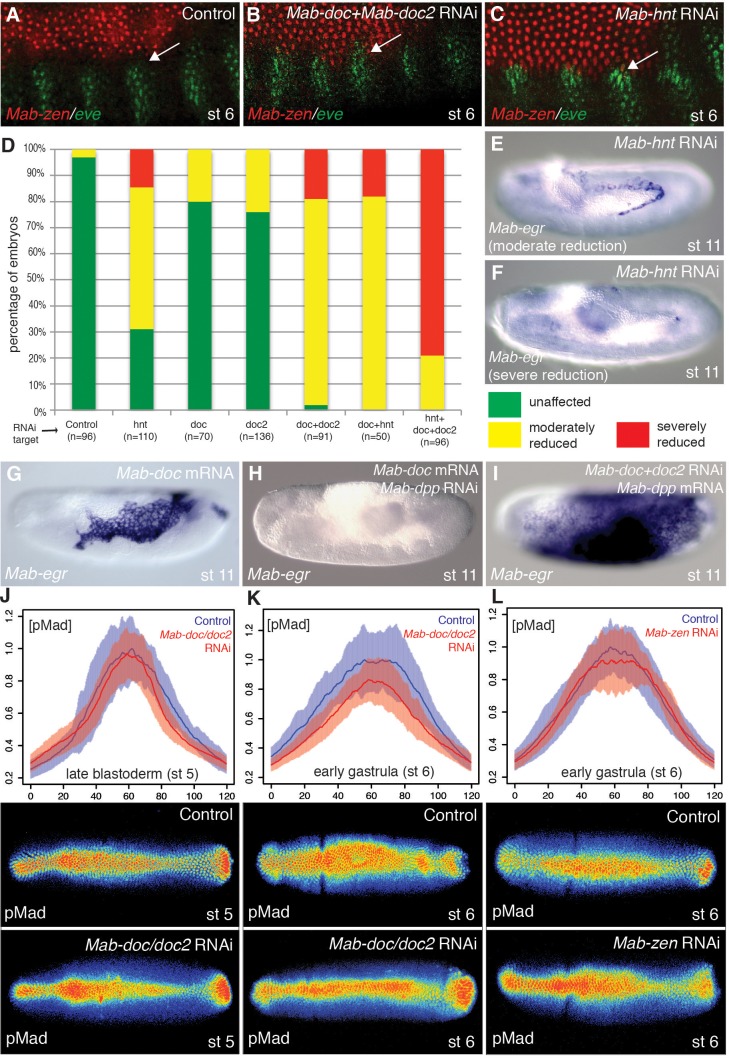
Figure 3. Mab-doc and Mab-hnt elevate BMP signaling to specify amnion in Megaselia.

(AC) Mab-zen and Mab-eve expression in early gastrula control embryo (A) and after Mab-doc/doc2 knockdown (B) or Mab-hnt knockdown (C). Arrows, gap between the Mab-eve and Mab-zen domains (A) that is suppressed in the knockdown embryos (B, C). (DF) Bar chart (D) quantifying the reduction of Mab-egr expression at stage 11/12 after Mab-hnt and/or Mab-doc/doc2 knockdown, and representative embryos of moderately reduced (yellow, E), or severely reduced (red, F) phenotypes. (GI) Mab-egr expression at germ band extension following Mab-doc overexpression (G), Mab-doc overexpression and Mab-dpp knockdown (H), and Mab-dpp overexpression and Mab-doc/doc2 knockdown (I). (JL) Mean and shaded standard deviation of pMad intensities in control injected embryos (blue) and in Mab-doc/doc2 knockdown embryos (red) at the cellular blastoderm stage (n = 10, control n = 10) (J), at early gastrulation (n = 11, control n = 11) (K), and in Mab-zen knockdown embryos (red) at early gastrulation (n = 10, control n = 17) (L) with representative embryos stained for pMad underneath each plot.

DOI: http://dx.doi.org/10.7554/eLife.20894.008

Figure 3.

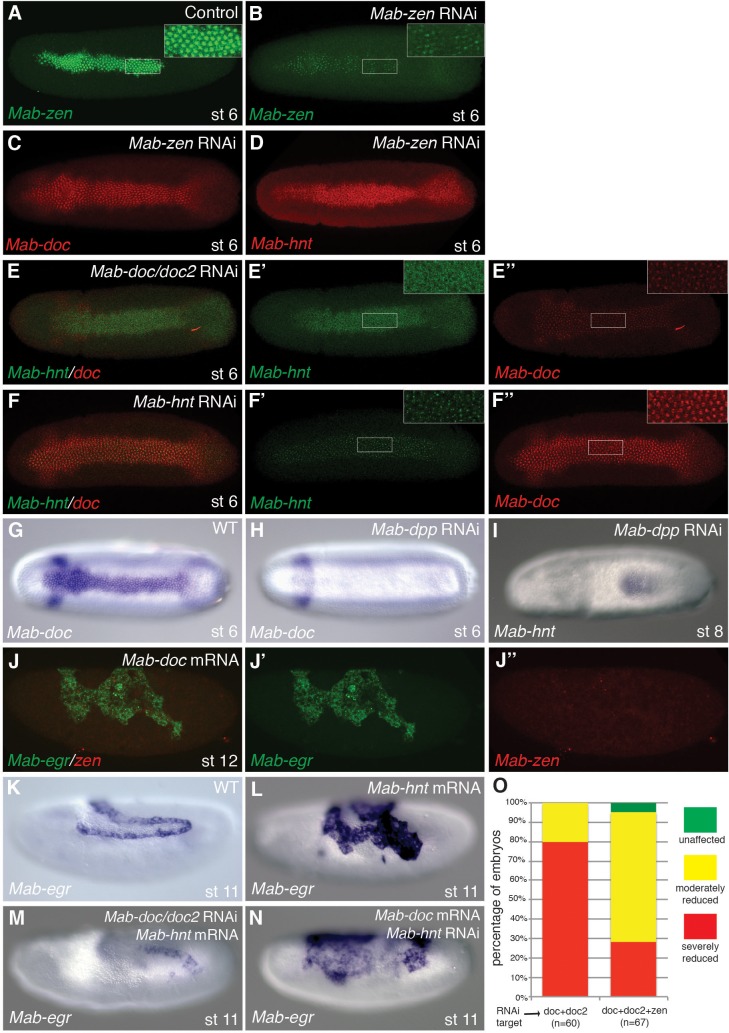
Figure 3—figure supplement 1. Function and regulation of Mab-doc and Mab-hnt.

Figure 3—figure supplement 1.

(AD) Mab-zen expression in control embryo (A), and Mab-zen (B), Mab-doc (C) and Mab-hnt (D) expression at early gastrulation following Mab-zen knockdown. (E, F) Mab-hnt and Mab-doc expression at early gastrulation following Mab-doc/doc2 knockdown (E) or Mab-hnt knockdown (F). (G, H) Mab-doc expression at early gastrulation in wild type (G) and after Mab-dpp knockdown (H). (I) Mab-hnt expression at early gastrulation following Mab-dpp knockdown (image from M. Rafiqi). (J) Mab-egr and Mab-zen expression at stage 11/12 following Mab-doc overexpression. (KN) Mab-egr expression at stage 11/12 in wild type (K), following Mab-hnt overexpression (L), following Mab-hnt overexpression and Mab-doc/doc2 knockdown (M) or Mab-doc overexpression and Mab-hnt knockdown (N). (O) Bar chart showing the percentages of embryos with normal (green), moderately (yellow) or severely reduced (red) Mab-egr expression at stage 11/12 following Mab-doc/doc2 knockdown or Mab-doc/doc2/zen knockdown. (AI) Dorsal views with anterior left. (JN) Lateral views with dorsal up and anterior left.