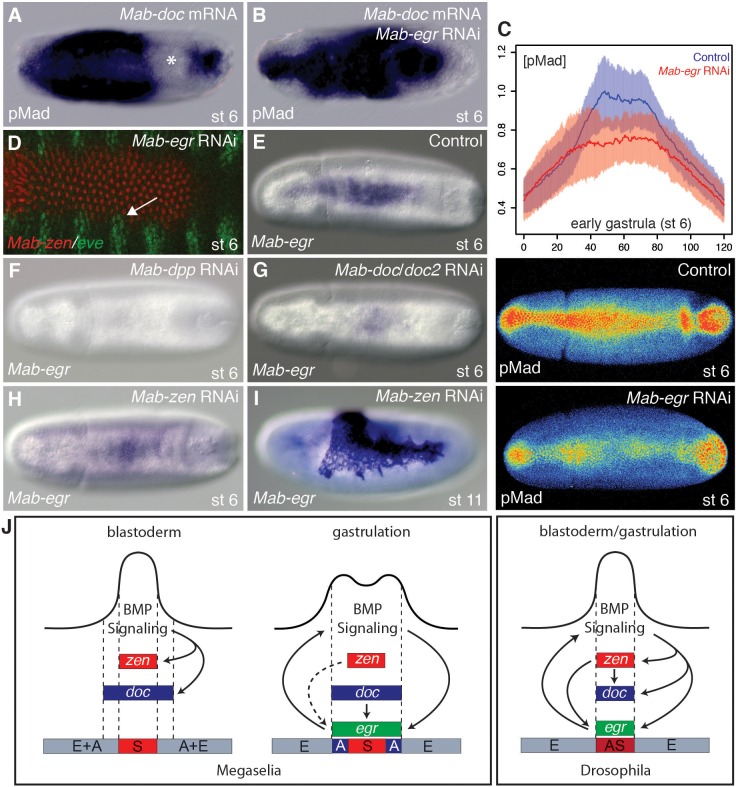
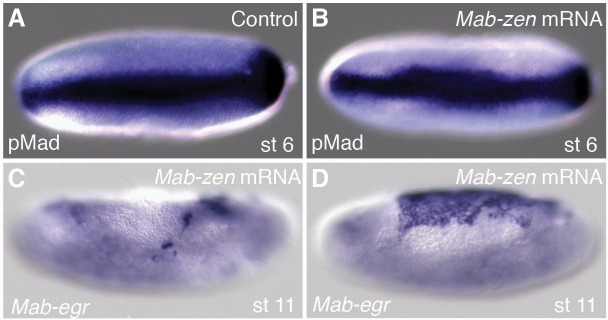
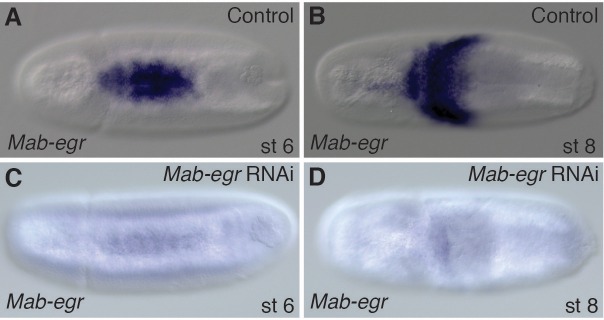
Figure 4. Mab-egr is downstream of Mab-doc and promotes BMP signaling.
(A, B) pMad staining following Mab-doc overexpression (A) or Mab-doc overexpression and Mab-egr knockdown (B). The asterisk marks site of endogenous pMad depletion. (C) Mean intensity and standard deviation of pMad staining in control injected embryos (blue, n = 10) and Mab-egr knockdown embryos (red, n = 9) at early gastrulation with representative embryos stained for pMad underneath the plot. (D) Mab-zen and Mab-eve expression at early gastrulation after Mab-egr knockdown with arrow indicating suppressed gap between the Mab-eve and Mab-zen domains. (E–H) Mab-egr expression in wild type (E), Mab-dpp knockdown (F), Mab-doc/doc2 knockdown (G), and Mab-zen knockdown (H) embryos at early gastrulation. (I) Mab-egr expression in a Mab-zen knockdown embryo after germ band extension. (J) BMP gene regulatory networks in Megaselia abdita and Drosophila melanogaster.


