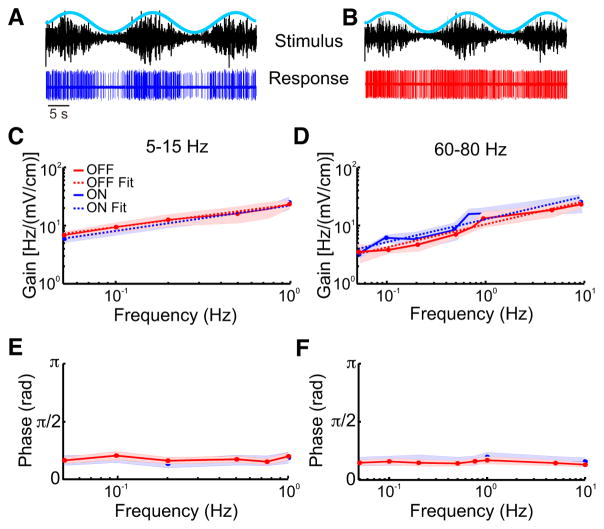
Fig. 7.
Responses of ON- and OFF-type cells to envelopes of different frequencies. A: an example trace of the response of an ON-type cell to the envelope. B: an example of the response of an OFF-type cell to the envelope. C: the gains of both ON-(blue) and OFF(red)-type cells for the 5- to 15- Hz and the 60-and 80-Hz carrier is shown. For both cell types, gain increased as a function of envelope frequency. Also shown are power law fits for ON-type cells (dashed blue line) and the OFF-type cells (dashed red line). D: the gain of both ON(blue) and OFF(red)-type cells both at 60 – 80 Hz is shown. For both cell types, gain increased as a function of envelope frequencies. Also shown are power law fits for ON-type cells (dashed blue line) and the OFF-type cells (dashed red line). E: the phase of both ON- and OFF-type cells calculated for 5–15 Hz. The phase was independent of envelope frequency. F: similar to E but for the 60- to 80-Hz carrier. The phase was independent of envelope frequency.

