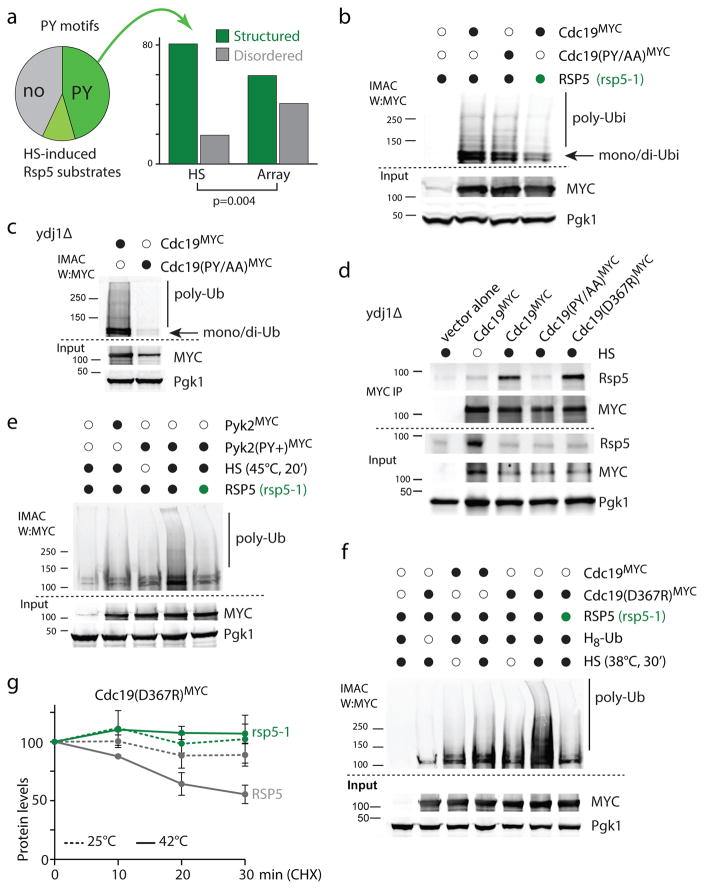
Figure 7. PY-motifs on substrates promote RSP5-dependent ubiquitination upon HS.
a. The pie chart (left) indicates which portion of HS induced Rsp5 candidate substrates identified in the two mass spectrometry experiments contains a proline-containing motifs ([PLSV]Px[YF], or PPPP; dark green), additional PxY motifs (light green) or no obvious PY motif (grey). × denotes any residue. The histogram (right) indicates whether [PLSV]Px[YF] or PPPP motifs are located in regions predicted disordered or not among Rsp5 candidate substrates induced by HS or identified in a protein array (Array). Assigned PY motifs are listed in Supplementary Table 5. b, c, e, f. IMAC analyzed by western blots. Samples were derived from cells expressing H8-ubiquitin (from a URA3 plasmid) and the indicated wild-type or mutants Cdc19 and Pyk2 (fused C-terminally with 13xMYC and expressed from a HIS3 plasmid). Py+ designates the A365P/L366N mutations in Pyk2. RSP5 (black) or rsp5-1 (green) cells were analyzed in b, e and f, and ydj1Δ cells in c. A HS at 45°C for 20min was applied in b and c, and in e when indicated (black); cells were subjected to a 38°C HS for 30min in f when indicated (black). d. MYC immunoprecipitation (IP) was performed after in vivo cross-linking with 1% formaldehyde (10 min) in cells grown at 25°C (empty circle) or during a HS (40°C, 20min; black). The indicated Cdc19 (fused C-terminally with 13xMYC) were expressed (GDP promoter) in ydj1Δ cells. The IP and input samples were analyzed by western blots as indicated. All uncropped images are in Supplementary Figure 8. g. Levels of Cdc19(D367R) C-terminally tagged with 13×MYC was determined by quantitative western blotting after incubating cells (wild type in grey and rsp5-1 in green) in the presence of 100μg/ml cycloheximide at 25°C (dotted lines) or 42°C (solid lines) at the indicated times in three independent experiments (average±SEM; source values are listed in Supplementary Table 5; representative images are shown in Supplementary Figure 7f).

