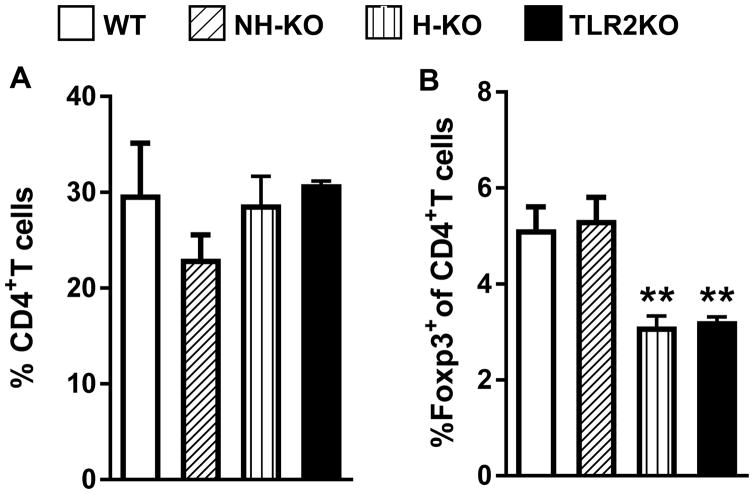
Figure 5.
Lungs were harvested from WT, NH-TLR2KO, H-TLR2KO, and TLR2KO chimeric mice and single cell suspensions prepared. Flow cytometry analysis was performed and the percentage CD4+ T cells out of either CD45.1+ or CD45.2+ cells, as determined by the chimeric phenotype is presented (A). The percentage of Foxp3+ cells is presented as a percentage out of gated CD4+ cells (B). Data are presented as mean ± SEM. Significance was determined by Bonferroni Multiple Comparisons test of One-Way ANOVA. Data is representative of two independent experiments with similar results. **p< 0.01. Figure is representative of 4–5 mice per group.

