Figure 1.

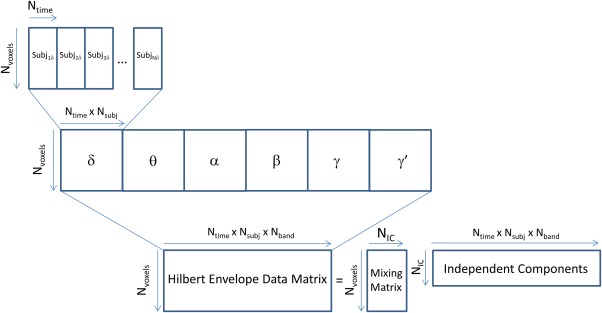
Schematic illustration of the multiband independent components analysis (ICA) procedure, showing time series concatenation over both subjects and frequency band. [Color figure can be viewed at http://wileyonlinelibrary.com]

Schematic illustration of the multiband independent components analysis (ICA) procedure, showing time series concatenation over both subjects and frequency band. [Color figure can be viewed at http://wileyonlinelibrary.com]