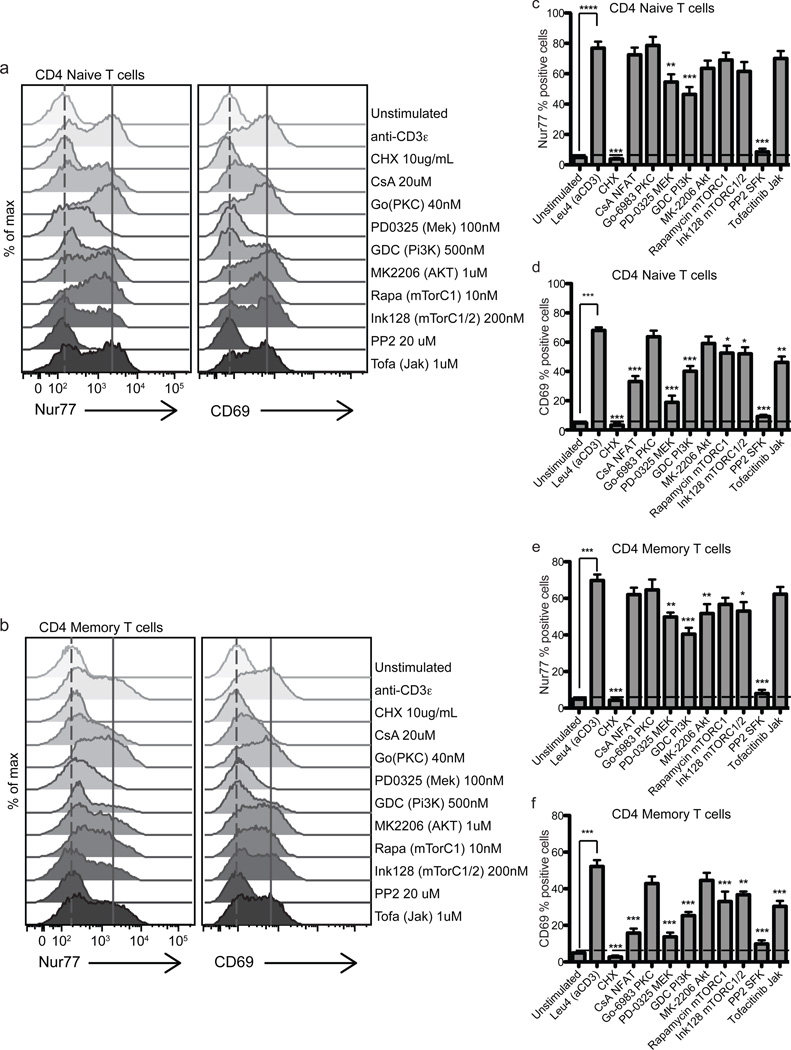
Figure 6. Nur77 levels reflect the integration of multiple TCR signaling pathways in human PBMCs.
Histograms represent Nur77 and CD69 induction in CD4+CD8− Naïve (a) and Memory T cells (b) treated with anti-CD3ε in the presence or absence of specific inhibitors for 4 hours. Data in figures 6 a–b are representative of at least 5 biologically different donors. (c–f) Bar graphs represent Nur77 or CD69 percent positive cells in CD4+CD8− Naïve (CD45RA+RO−) (c,d), Memory (CD45RA−RO+) T cells (e,f) treated with anti-CD3ε 1.0 µg ml−1 in the presence or absence of specific inhibitors for 4 hours. Horizontal dashed line in 6c–f marks Nur77 and CD69 % positive of unstimulated cells. Positive gate was set at highest 5% of unstimulated cells. Values in 6c–f are the mean of 5–6 biologically different donors +/− SEM. One-way ANOVA was used to compare unstimulated samples (treated with DMSO vehicle control) and inhibitor treatment groups to Leu4 + inhibitor vehicle control (DMSO). ns p>0.05, *p<0.05, **p<0.01, ***p<0.001

