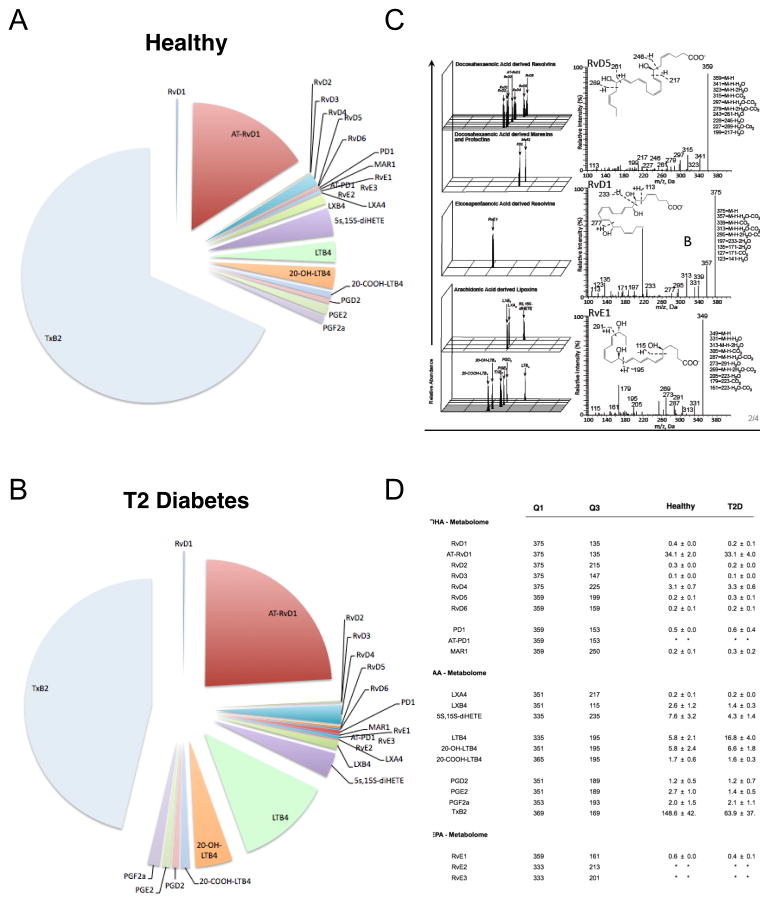
Figure 5. Lipid mediator metabololipidomic profiling of healthy and diabetic serum lipid mediators of subjects with and without type 2 diabetes were evaluated.
(A–B) Proportions of lipid mediators from the bioactive AA, EPA and DHA metabolomes identified in Type 2 diabetes patient and healthy volunteer serum. (C) Representative MRM chromatograms of identified mediators in healthy and diabetic serum; left panel: fragmentation spectra, right panel: MS-MS fragmentation spectra employed in the identification of RvD5, RvE1 and RvE1. (D) Quantification of lipid mediators, where: Q1, M–H (parent ion); and Q3, diagnostic ion in the MS-MS (daughter ion), along with mean ± SEM values for healthy and diabetic mediators identified from serum. The detection limit was < 1 pg and * represents below detection limits. Results are expressed as mean ± SEM; n = 5 distinct serum preparations.

