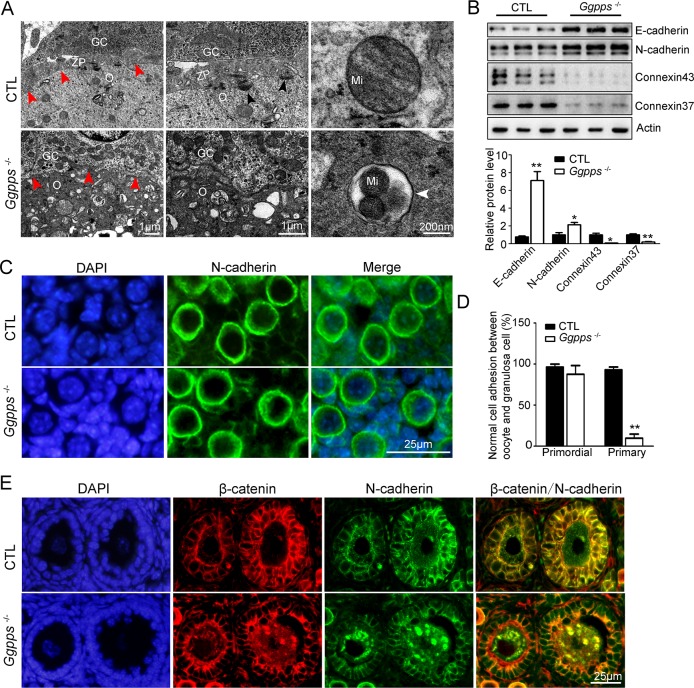
Fig 5. GGPP depletion in oocytes inhibits the physical connection between oocyte and granulosa cells.
(A) Transmission electron microscopy analysis of PD 13 ovaries. Zona pellucida between a granulosa cell (gc) and oocyte (o) is indicated by red arrowheads in the primary follicles. Black arrowheads indicated the gap junctions. White arrowhead indicated the autophagosomes. Mi, Mitochondria. (B) Western blot analysis of N-cadherin, E-cadherin, connexin 37, and connexin 43 using lysates from PD 8 ovaries. Actin and GAPDH were used as the internal loading controls. (C-E) β-catenin, and N-cadherin immunofluorescence and the quantification of adhesion between oocyte and granulosa cells in the primordial and primary follicles of PD 13 ovaries. The cell adhesion was assessed as described in Materials and Methods (n = 4). Data were presented as the mean ± SEM. *p<0.05, **p<0.01. Scale bar, 25 μm.

