
Figure 3. Regulation of ENaC by miR-263a.
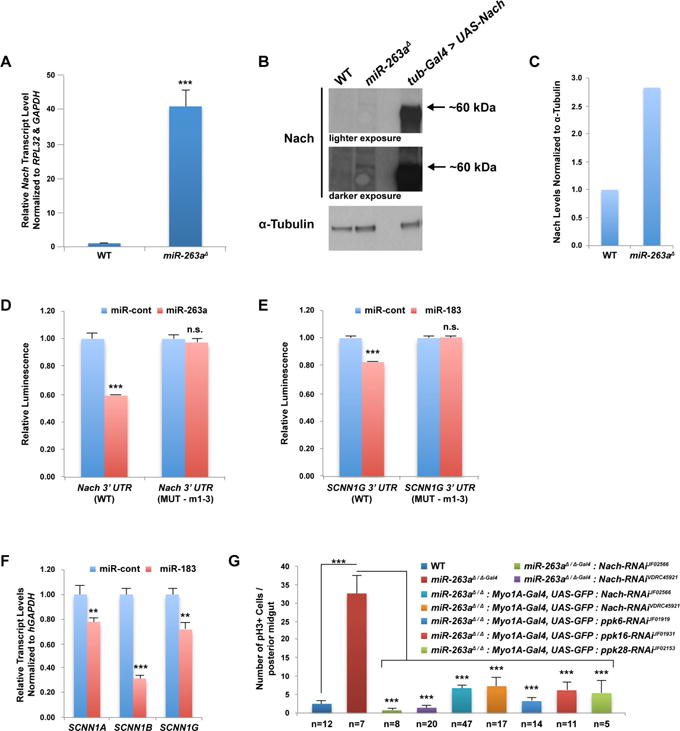
(A) Relative Nach transcript level in miR-263a mutant midguts. (B) Western blot analysis of Nach in miR-263a mutant midguts. α-Tubulin was used as loading control. (C) Quantitative analysis of the Western blot from (B). (D) Nach 3′ UTR luciferase reporter assay. (E) SCNN1G 3′ UTR luciferase reporter assay. (F) Relative transcript levels of human ENaC subunits after overexpression of miR-183 in CFBE41o- cells. (G) The average number of pH3+ cells in the posterior midguts at 14 days old. Depletion of Nach using two independent RNAi lines and two different Gal4 drivers in the miR-263a mutant background suppressed the increased number of pH3+ cells. The phenotype was also suppressed when other ENaC subunits were depleted in the mutant background. “n” denotes the number of posterior midguts examined for each genotype. Error bars indicate SEM. **P < 0.05 and ***P < 0.001 (two-tailed t-test). See also Figure S3 and Table S1.