
Figure 5. Increased ENaC activity disrupts intestinal homeostasis in miR-263a mutants.
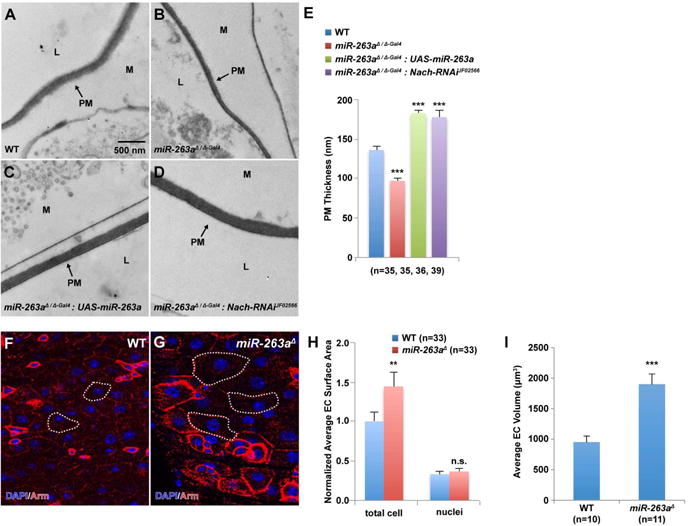
(A–D) EM cross-sections of posterior midguts. (B) miR-263a mutants show reduced PM thickness compared to wild-type (A). Overexpression of miR-263a (C) and depletion of Nach (D) in the mutant background. Arrows indicate the PM (peritrophic matrix), M (mucus), and L (lumen with digested food). (E) Quantitative measurements of the PM thickness. “n” denotes the number of PM thickness measurements for each genotype. (F–G) Enlarged ECs in the miR-263a mutants visualized by anti-Arm marking the cell membrane. White dotted lines outline the representative ECs. (H) Normalized quantitative measurements of the total EC and their respective nuclei surface area. “n” denotes the number of surface area measurements for each genotype. (I) Quantitative measurements of the total EC volume. “n” denotes the number of cell-volume measurements for each genotype. Error bars indicate SEM. **P < 0.05 and ***P < 0.001 (two-tailed t-test). See also Figure S5.