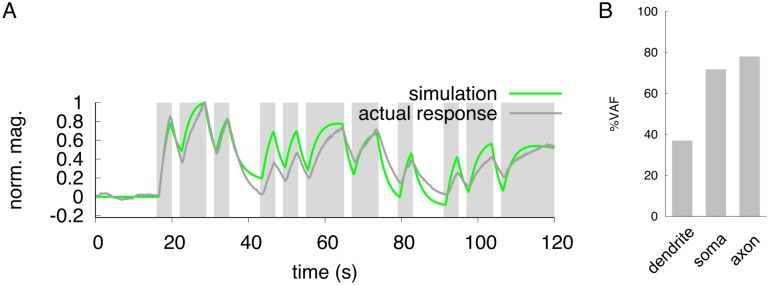
Fig 4. Neuronal responses to a pseudorandom stimulus.
(A) Dark-gray line indicates the actual responses in the soma to pseudorandom changes of 50 mM/0 mM NaCl concentration. The green line indicates the result of simulation in the soma to a pseudorandom input stimulus. Gray shading represents the downstep period of NaCl concentration for actual imaging (dark-gray) or simulation (green). (B) Evaluation of simulation by VAF index. The response patterns in the dendrite and axon are shown in S3 Fig.

