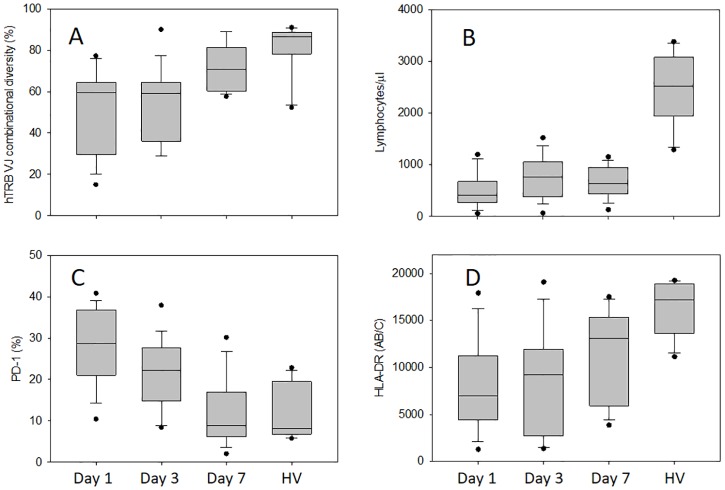
Fig 1. Immune cell surface antigen expression, lymphocyte count, and TCR diversity in septic shock.
TCR diversity (expressed as a percentage) was calculated as the ratio of the observed number of rearrangements to the theoretical number (A). Lymphocyte count (B), PD-1 expression by CD4+ T cells (C), and HLA-DR expression by CD14+ monocytes (D) measured on day 1, day 3, and day 7 after the diagnosis of septic shock compared with that in healthy volunteers (HV). Data are shown as box plot with medians (lines inside boxes), 25th and 75th quartiles (lines of boxes) and whiskers indicate the range. Any data not included between the whiskers were plotted as an outlier with small circle. **, p<0.01, *p<0.05 vs. healthy volunteers; ††, p<0.01, †, p<0.05 vs. day 1.

