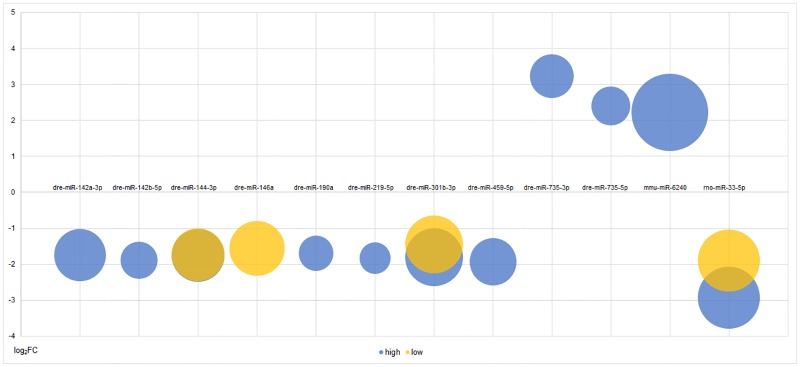
Fig 2. The fold changes and predicted target gene amounts of differentially expressed miRNAs under BDE47 treatments.
The locations of bubble centers indicated fold changes of the miRNAs, and the sizes of bubbles indicated predicted target gene amounts. Blue: high concentration exposure; yellow: low concentration exposure.

