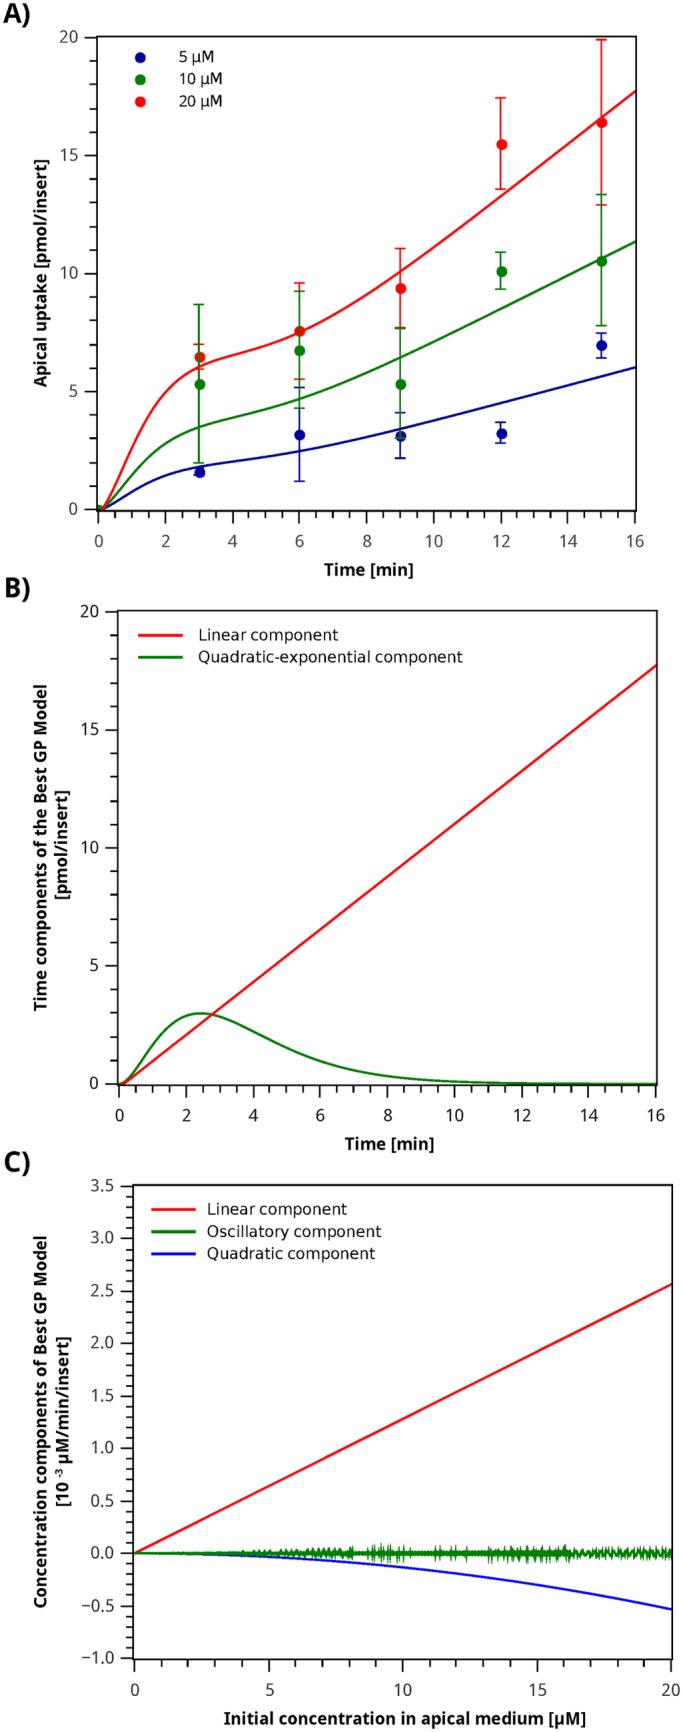
Fig 7. Best GP model simulation of the apical iron uptake and study of its mathematical components.

A) Simulation and experimental data. Circles correspond to the average value, error bars indicate standard deviation for each sample, and the curve plotted corresponds to simulation results for the model described by ApUp, Eq (9). B) Time components of Best GP Model. The curves plotted correspond to simulation results for the components of the model described by Eq (10) with C0 = 20 µM. (red) linear component and (green) quadratic-exponential component. C) Concentration components of Best GP Model. The curves plotted correspond to simulation results for the components of the model described by Eq (11). (red) linear component; (green) oscillatory component and (blue) quadratic component.
