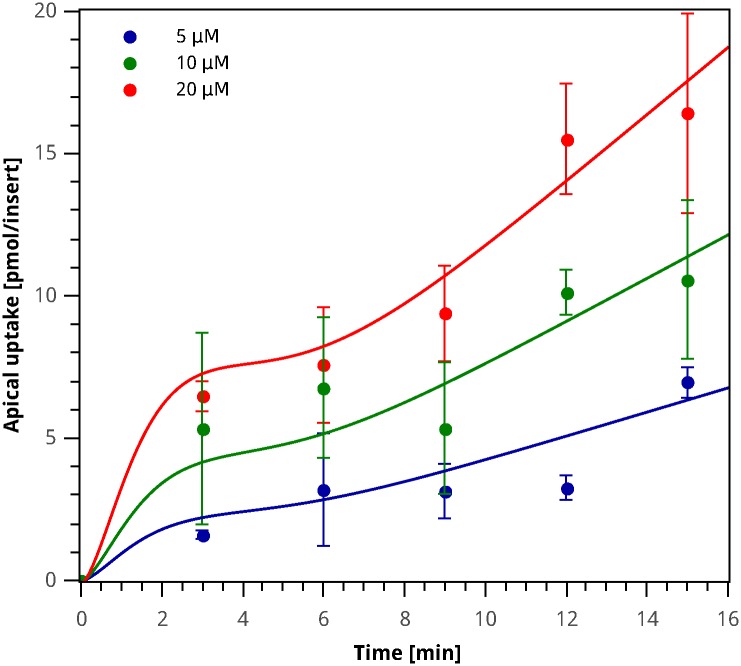
Fig 8. Apical iron uptake experimental data and Pruned GP Model simulation.
Circles correspond to the average value, error bars indicate standard deviation for each sample, and the curve plotted corresponds to simulation results for the model described by Eq (12).

