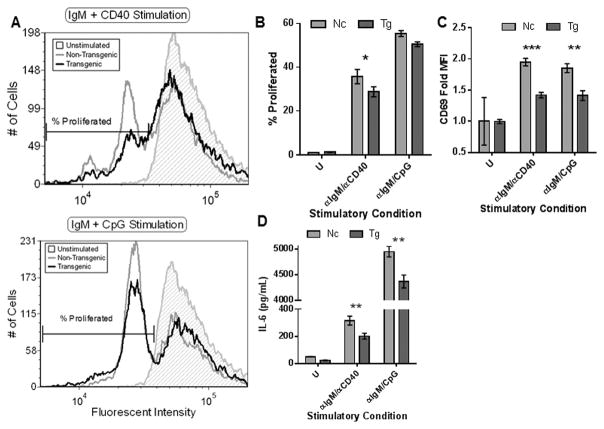
Figure 5. Primary TLR10 transgenic murine B-cell activation is suppressed compared to non-transgenic control mice.
Murine spleens from 3 transgenic and 3 non-transgenic mice were collected, pooled and a single-cell suspension was obtained. Murine B-cells were further purified by a negative selection antibody cocktail. (A, B, C) B-cells were pre-incubated with CFSE prior to stimulation with the indicated agonists for 72 hours. After stimulation, live cells were gated by forward and side scatter characteristics. (A) Representative example of a fluorescent CFSE B-cell cycling profile. The percentage of divided B-cells (B) and CD69 expression (C) was analyzed from three different replicates based upon the marker present in (A). (D) Pooled B-cells were stimulated for 24 hours with the indicated agonists and cell-free supernatant collected to measure mIL-6 production. Data is representative of three independent experiments. * p < 0.1; ** p < 0.05; *** p < 0.01

