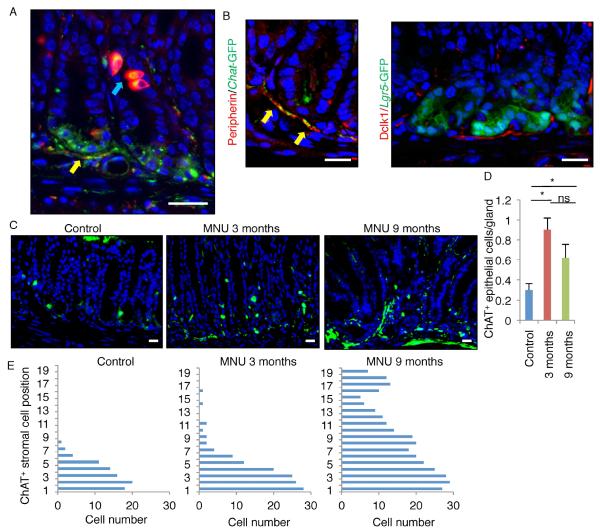
Figure 1. ChAT+ tuft cells and nerves expand during carcinogenesis.
(A) Dclk1 staining (red) in Chat-GFP (green) mice antrum. Blue arrow indicates tuft cells, and yellow arrow indicates nerves. (B) (Left) Peripherin staining (red) in Chat-GFP mice antrum. Arrows indicate GFP+ nerves. (Right) Dclk1 staining (red) in Lgr5-GFP mice antrum. (C) Chat-GFP expression with or without MNU treatment (3 months and 9 months after the beginning of MNU). (D) The number of ChAT+ epithelial cells per gland in MNU-treated or untreated stomachs. Total 100 glands per group are analyzed. (E) Cell position of ChAT+ stromal cells in MNU-treated or untreated stomachs. Total 50 glands per group are analyzed. Means ± SEM. *p < 0.05 (ANOVA). DAPI = blue. Bars = 20 m. See also Figure S1.

