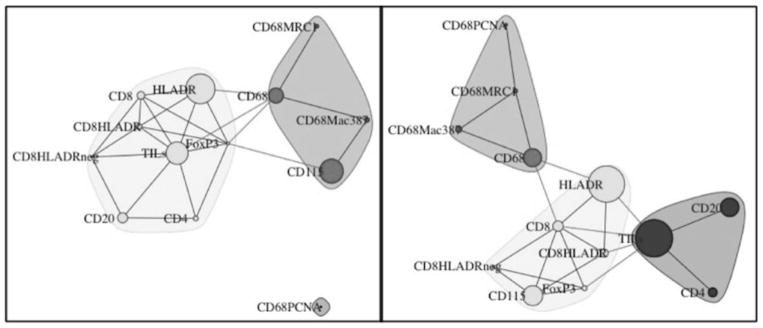
Fig. 4.
The immune landscape in DCIS. Visualization of the immune landscape based on 65 cases of nHG-DCIS (left) and 52 cases of HG-DCIS (right). The connecting lines (edges) represent the correlation between the different cell populations. Edges with r < 0.35 and r > −0.35 were filtered out. Only positive correlations remained after filtering. The size of the nodes represents the mean percentage of the cell type in the cohort.

