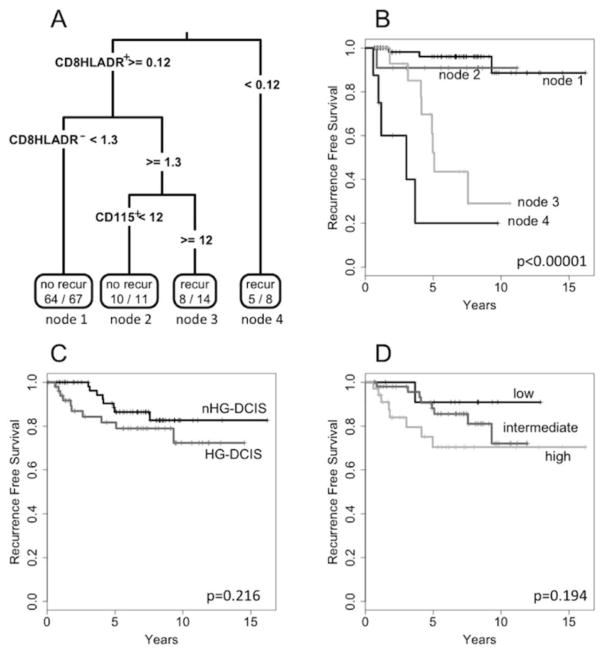
Fig. 6.
Classification and Regression Tree analysis. Panel A: classification tree predicting recurrence events in DCIS based on immune cell infiltrates. Numbers in the end nodes represent the (number of correctly predicted cases)/(number of predicted cases) for that node. Panel B: Kaplan-Meier recurrence free survival curves for DCIS cases based on the classification tree. Panel C: K-M curves for HG-DCIS vs. nHG-DCIS. Panel D: K-M curves for DCIS cases separated by VNPI score.

