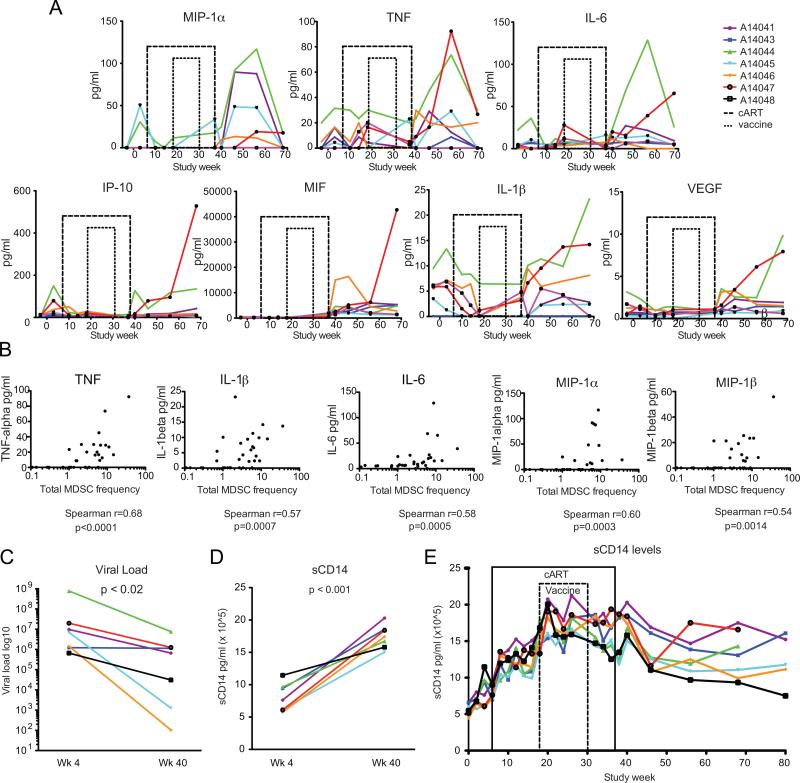
FIGURE 6.
Longitudinal analysis of plasma inflammatory cytokine kinetics. Plasma was batch tested for the following cytokines, chemokines and growth factors: GMCSF, TNF, IL-1β, IL-4, IL-6, MIG, VEGF, HGF, EGF, IL-8, IL-17, MIP-1α, IL-12, IL-10, FGF-Basic, IFN-γ, G-CSF, MCP-1, IL-15, IP-10, MIP-1β, Eotaxin, RANTES, IL-1RA, I-TAC, MDC, IL-5, IL-2 and MIF at weeks -3, 3, 10, 14, 18, 37, 40, 46, 56 and 68. sCD14 levels were assessed at weeks 0, 2, 4, 6, 8, 10, 12, 14, 16, 18, 20, 22, 24, 26, 32, 34, 36, 38, 40, 56, 68, and 80. (A) Cytokine kinetics are shown for MIP-1α&β, TNF, IL-6, IP-10, MIF, IL-1β, and VEGF. (B) Correlation analyses are shown between MDSC and TNF, MIP-1α&β, IL-6, IL-1β during post-cART viremia. (C) Viral load comparison between 4 weeks post-infection (wk 4) and 3 weeks post-cART interruption (wk 40), (D) sCD14 comparison between 4 weeks post-infection (wk 4) and 3 weeks post-cART interruption (wk 40). (E) Longitudinal analysis of sCD14 levels over time. Cytokines were correlated by Spearman's rank correlation coefficient. Viral loads and sCD14 levels were compared by paired t test.

