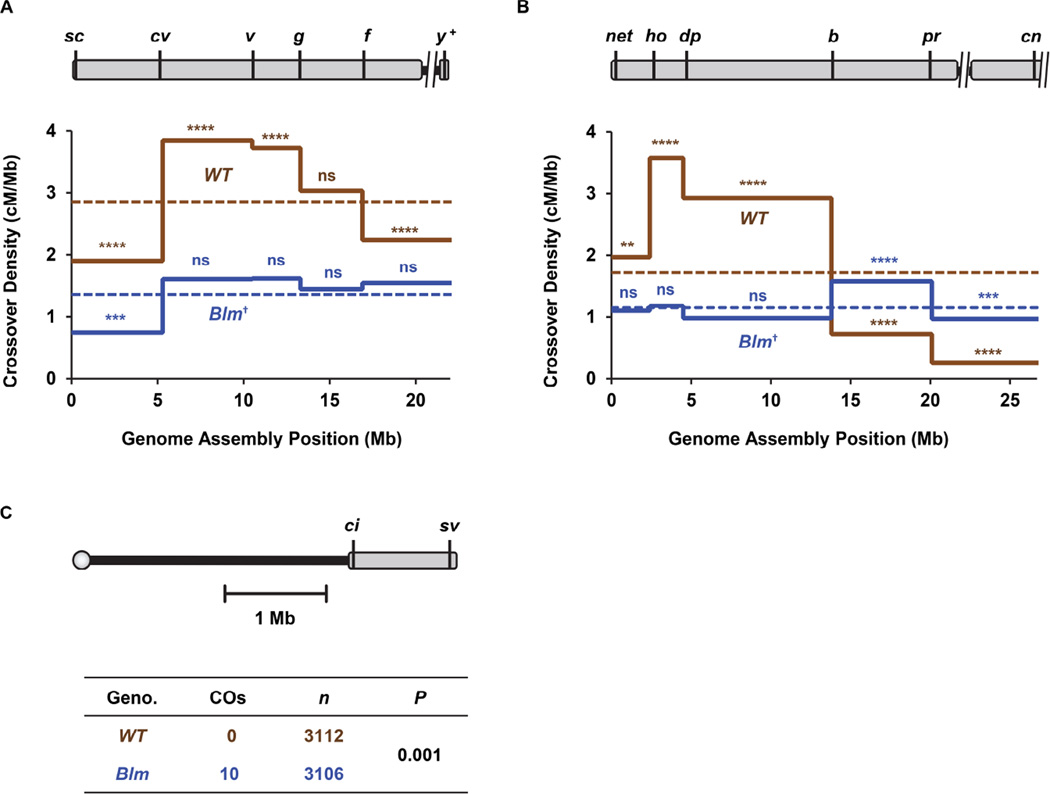
Figure 2. Intrachromosomal effects of loss of crossover patterning.
(A) Crossover distribution on the X chromosome. Schematic at the top is as in Figure 1 except that unassembled satellite sequences and the centromere are not included in density calculations. Locations of markers used to score crossovers are indicated. The graph below shows crossover density in each interval in wild-type flies (n=2179) and in Blm mutants (n=1099). Dotted line is mean density across the entire region assayed. Indicators of statistical significance are for chi-squared tests on observed number of crossovers versus the expected number if crossover number is proportional to physical size: ns, P >0.05; ***P <0.001; ****P <0.0001 after correction for multiple comparisons. †P <0.001 indicates significance of Blm distribution across all intervals as compared to wild-type, as determined by G-test of goodness of fit. For complete dataset, refer to Table S3.
(B) Crossover distribution on 2L. Schematic and graph are as in panel A. n=4222 for wild type and 1171 for Blm. **P <0.003; †P < 0.0001 for overall distribution in Blm mutants compared to wild-type, (G-test). For complete dataset, refer to Table S1. Transposable elements were excluded from physical lengths in these analyses. See Figure S4 for details.
(C) Crossovers on chromosome 4. Schematic is as in panels A and B, but the scale is different. The table below shows the number of flies scored and the number of crossovers detected. For details on parental and recombinant classes, please refer to Table S4. Crossover density on the X, 2L, and 4 are shown in Figure S2A.

