Fig. 2.
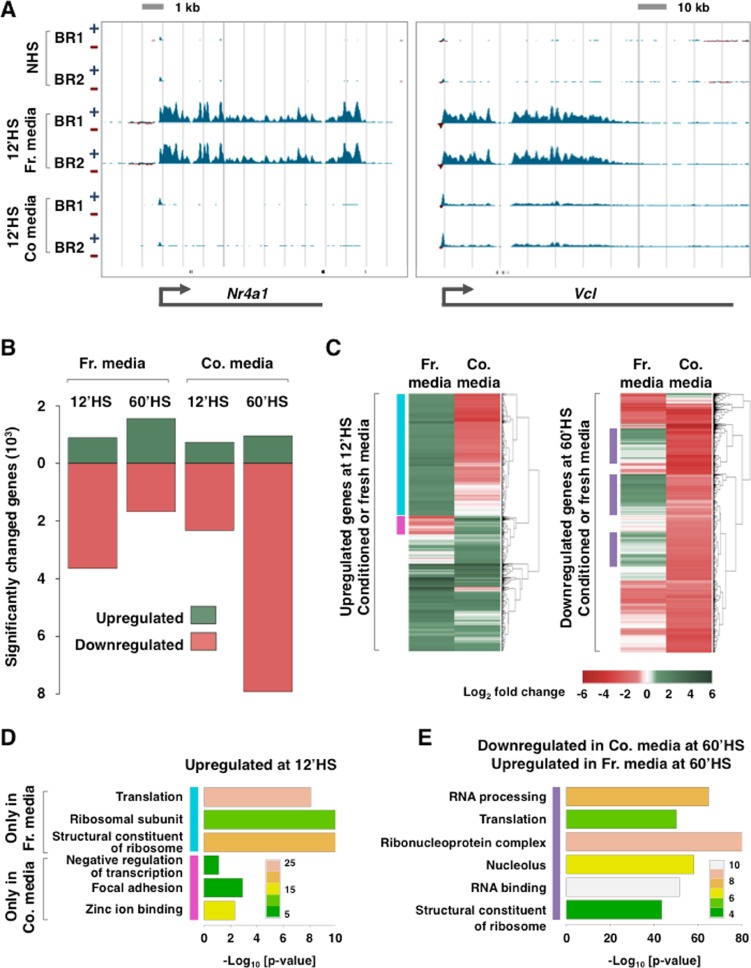
Genome-wide transcription profile change caused by fresh media is different than caused by HS. a Genome-browser screenshots of PRO-seq density in three conditions with two biological replicates each. PRO-seq density in sense and antisense directions is shown in blue and red, respectively. Small vertical black bars at the bottom represent the genomic regions that do not map uniquely at 36 bp resolution. b Number of significantly changed genes using heated fresh media or heated conditioned media for HS. Upregulated genes are shown in green and downregulated genes are shown in red. c. Heatmap showing the status of PRO-seq density change in all genes that show significant upregulation at 12 min of HS with either fresh or conditioned media (left) and all genes that show significant downregulation at 60 min of HS with either fresh or conditioned media (right). The color bars represent genes that were examined in gene ontology analysis in d. d Gene ontology analysis of enriched molecular functions and biological processes in significantly upregulated genes at 12 min of HS with fresh media but significantly downregulated in conditioned media is indicated by the blue bar, while significantly downregulated genes at 12 min of HS with fresh media but significantly upregulated in conditioned media are indicated by the magenta bar. e Gene ontology analysis of enriched molecular functions and biological processes in significantly upregulated genes at 60 min of HS with fresh media but significantly downregulated in conditioned media (purple bar)

