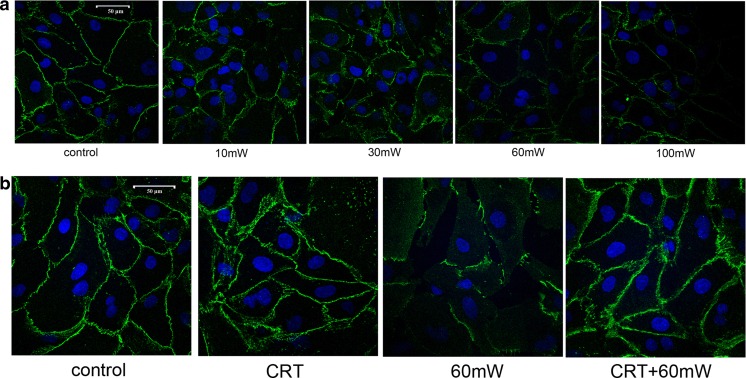
Fig. 4.
The effect of CRT on the VE-cadherin continuity of HMEC subjected to MR. The immunofluorescence staining of FITC-VE-cadherin was used to analyze the spatial distribution of VE-cadherin. a The effect of different power densities of MR (10, 30, 60, or 100 mW/cm2) on the distribution of VE-cadherin of HMEC. b The effect of CRT pretreatment (25 pg/mL, 20 min before radiation) on the distribution of VE-cadherin of HMEC. Samples were examined by confocal laser scanning microscopy. Scale bar is 50 μm. Experiments were done in triplicate (n = 3), and representative images are presented

