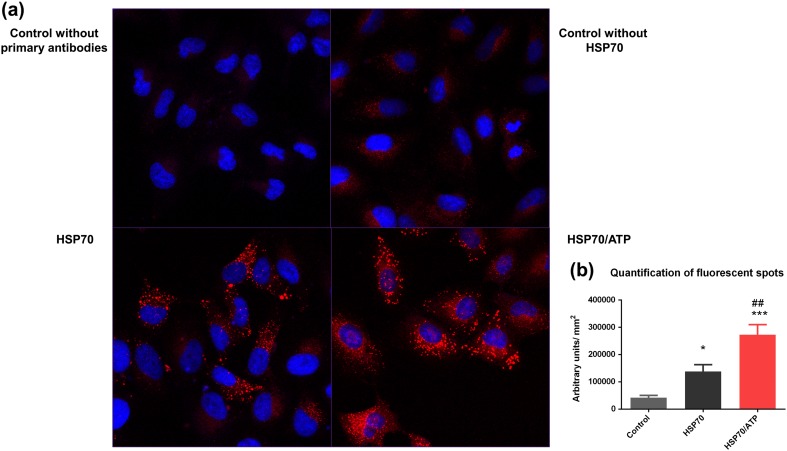
Fig. 2.
Fluorescent protein proximity assay. HLA probe chain reacted, producing red fluorescent spots when both target proteins were within interacting range. a The top images show confocal microscopy analyses of technical control without the addition of primary antibodies and experimental control without the addition of eHSP70. The bottom images show confocal microscopy analyses of A549 cells treated with eHSP70 with or without ATP pretreatment. b Fluorescence intensity and morphometric analysis from control and treated cells. The cells were analyzed using the ratio between the intensity of red fluorescence and size of cytoplasm with the ImageJ software. Data are reported as means ± SEM. Statistically significant differences as determined by one-way ANOVA followed by Tukey’s test are indicated: *p < 0.05; ***p < 0.001 compared with control group; ##p < 0.01 compared with HSP70 group

