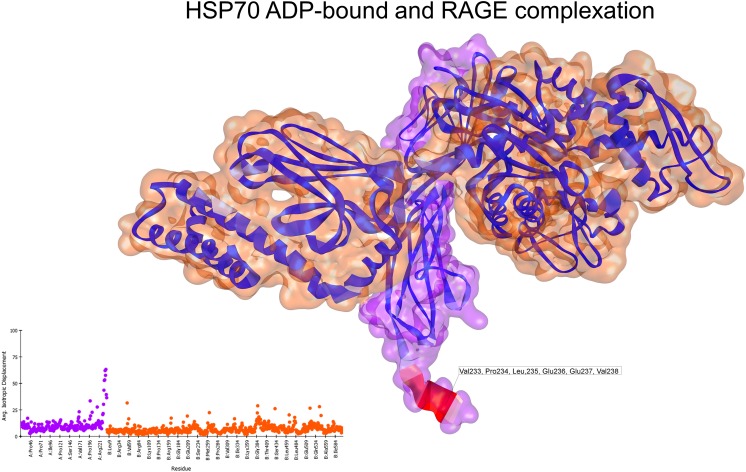
Fig. 3.
Normal mode analyses for the complex 3CJJ-2KHO. Structures are shown according to their respective residue deformability. The color scale ranges from blue to red with increasing flexibility of residues. Every structure includes a corresponding scatter plot for residue deformability. Analysis of the interacting complex between the HSP70 APO state and monomeric RAGE showed that the most flexible regions of the ligand structure were relaxed after the interaction. RAGE surface is colored purple and HSP70 surface is colored orange. Residues that most contribute to the deformability of the system are indicated

