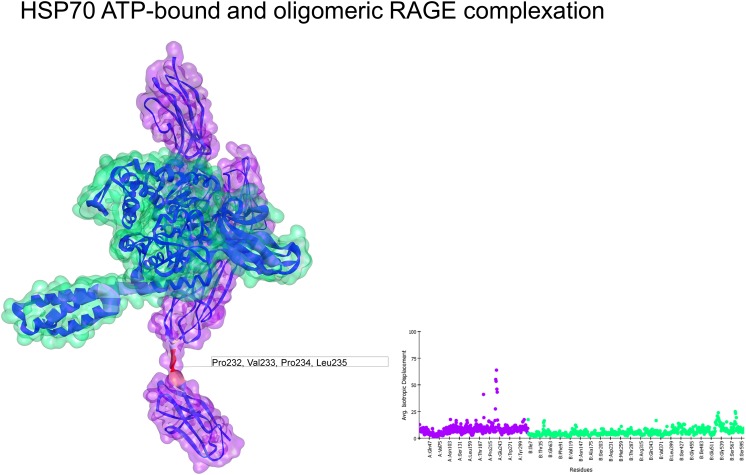
Fig. 6.
Normal mode analyses for the complex 4LP5-4B9q. Structures are shown according to their respective residue deformability. The color scale ranges from blue to red with increasing flexibility of residues. Every structure includes a corresponding scatter plot for residue deformability. RAGE surface is colored purple and HSP70 surface is colored green. Residues that most contribute to the deformability of the system are indicated

