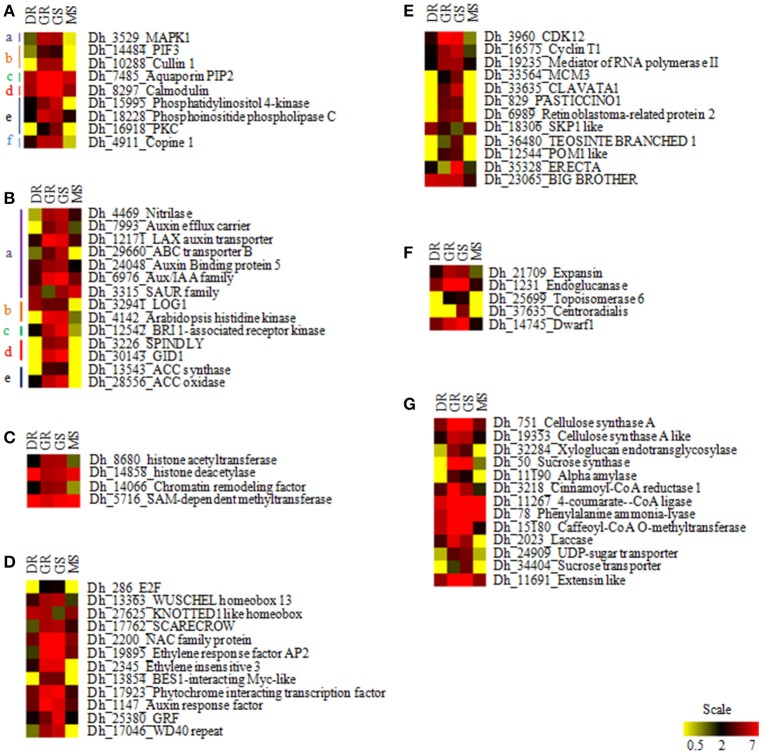
Figure 6.
Heatmap showing transcript abundance of growth-associated genes in different vegetative stages of D. hamiltonii generated using MeV. Scale at the bottom represents relative expression. Red represents highly expressed yellow represents poorly expressed genes. (A) Environmental signal perception: a, mitogen associated; b, Circadian rhythm; c, water transport; d, calcium signaling; e, PI signaling; f, response to humidity, (B) Phytohormone related genes: a, auxin; b, cytokinin; c, brassinosteroid; d, gibberellin; e, ethylene, (C) Epigenetic modulators, (D) Transcription factors, (E) Cell cycle regulators, (F) Cell expansion, and (G) Cell wall biogenesis.

