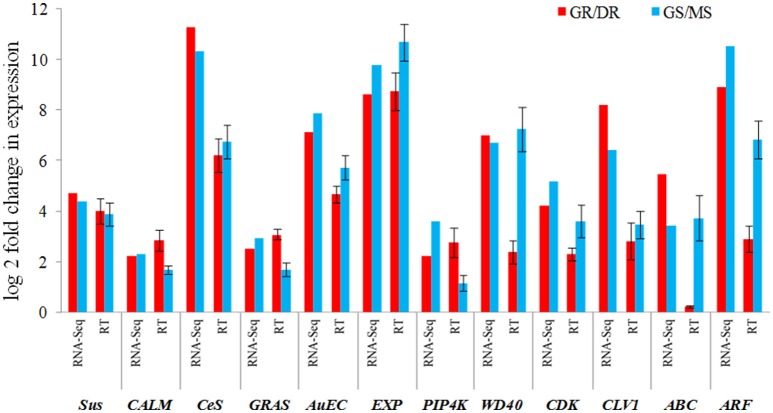
Figure 8.
Comparison between transcriptome and qRT–PCR expression profiles of 12 selected growth related genes (Sus, sucrose synthase; CALM, calmodulin; Ces, cellulose synthase; GRAS, GRAS family TF; AuEC, auxin efflux carrier; EXP, expansin; PIP4K, phosphatidylinositol-4-kinase; WD40, WD40 repeat; CDK, cyclin dependent kinase; CLV1, clavata1; ABC, ABC transcporter; ARF, auxin response factor). Error bar represents the SD for replicated experiments.

