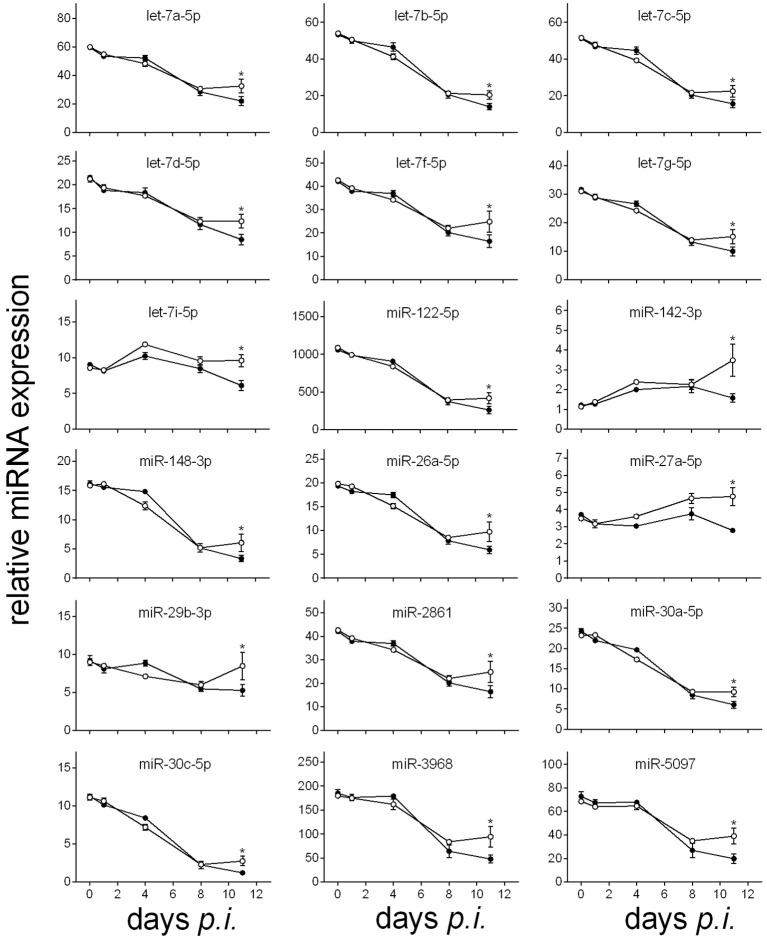
Figure 3.
Time course of relative miRNA expression with increased levels in the liver of vaccinated mice toward the end of the crisis phase of P. chabaudi infections in comparison to non-vaccinated mice. Relative miRNA expression was normalized to the mean constitutive expression of the corresponding miRNAs. Open circles are values of vaccinated mice and filled circles are those of non-vaccinated mice. Values are given in mean ± SD. Significant differences are indicated by *(P < 0.05).

