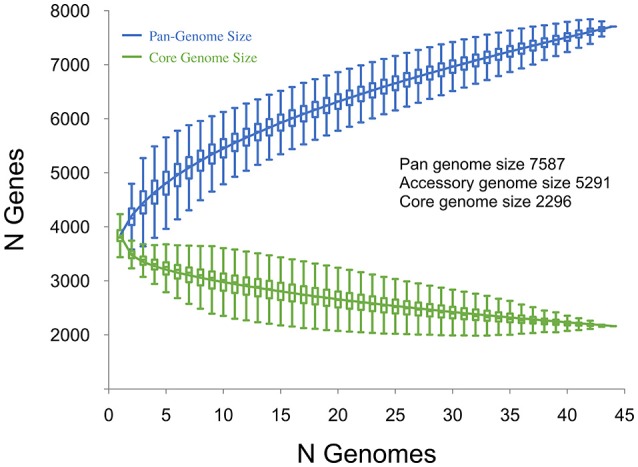
Figure 6.

Core and pan-genome analysis for 44 C. difficile RT014 genomes. The total number of genes in the pan (blue) and core (green) genomes are plotted as a function of the number of genomes sequentially added (n = 44). Box plots indicate 25th and 75th percentiles with medians shown as horizontal lines and whiskers set at 10th and 90th percentiles. For the pan-genome, the continuous curve (blue) shows the fit (r2 = 0.999) of the power-law regression model. The pan-genome size is calculated at 7587 genes at n = 44 and displays characteristics of an open genome: (i) the trajectory of the pan-genome increases unboundedly as the number of genomes are added and (ii) Bpan (≈ γ, Tettelin et al., 2008) was estimated as 0.43. For the core genome, the continuous curve (green) shows the fit (r2 = 0.979) of the exponential regression model. The number of core genes converges to 2296 at n = 44, accounting for 30.3% of the total gene repertoire.
