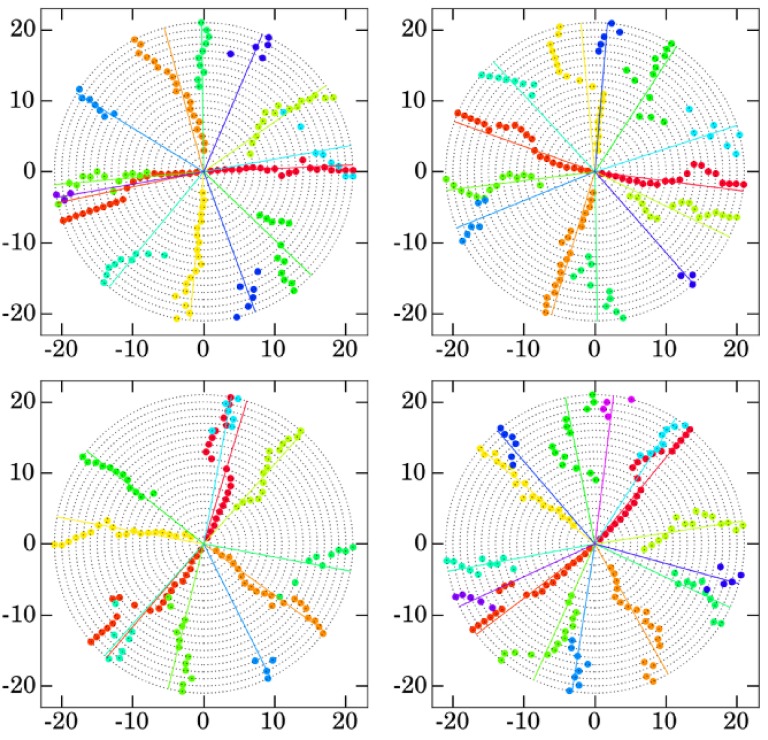
Figure 2.
Evolution of the angles of the different leaves for genotypes Bur (top left), Col (top right), Sha (bottom left), and Tsu (bottom right). The angle α of the v-th leaf on day t is displayed on the circle centered in (0, 0) and of radius t, i.e., have coordinates (t cos(α), t sin(α)). Straight lines indicate the mean angles for each leaf throughout their respective growth. Manually acquired data. 

