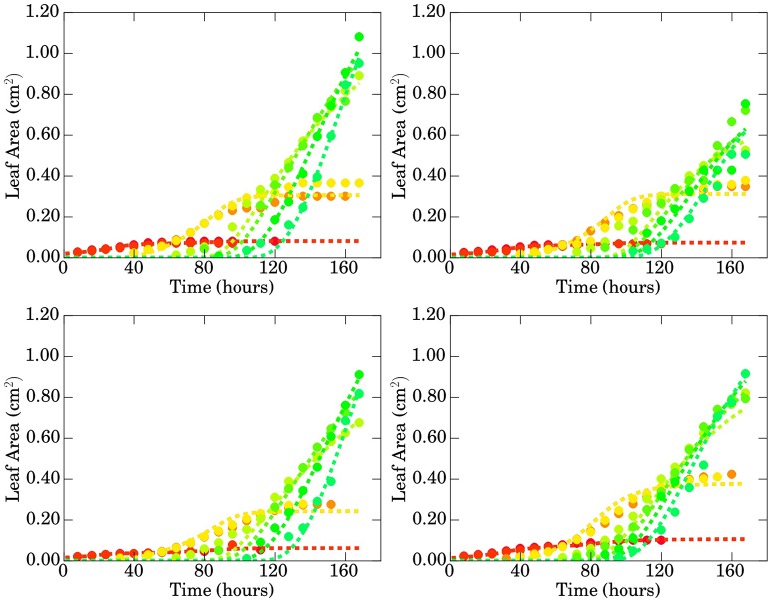
Figure 9.
Comparison of the areas of the different leaves (in cm2) with respect to time (in hours) for genotypes Bur (top left), Col (top right), Sha (bottom left), and Tsu (bottom right). Data obtained through image processing is represented by filled circles while predictions of the calibrated model are represented by dashed lines. 

