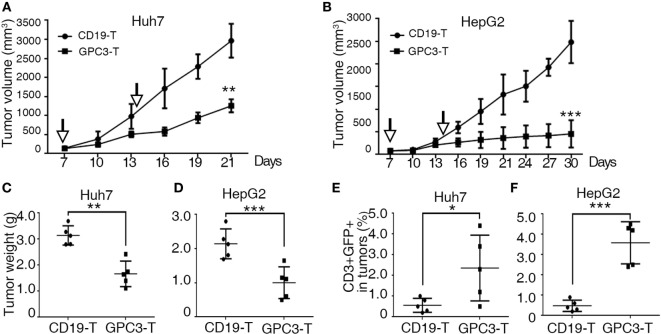
Figure 5.
Cytotoxicity of glypican 3 (GPC3)-chimeric antigen receptor (CAR) T cells against hepatocellular carcinoma cell lines in xenografts. (A,B) Growth curve of Huh-7 and HepG2 xenografts (n = 5) treated with the Control- or GPC3-CAR T cells at indicated time point (arrow). At the end of the experiment, the tumors treated with GPC3-CAR T cells were significantly smaller than those in the Control group. (C,D) Huh-7 and HepG2 tumor weights from the mice treated with CAR T cells at the end of the experiment, respectively. (E,F) GPC3-CAR T cells in tumors were significantly higher than Control-CAR T groups. Results represent mean ± SD. *P < 0.05, **P < 0.01, and ***P < 0.001 with T-test.

