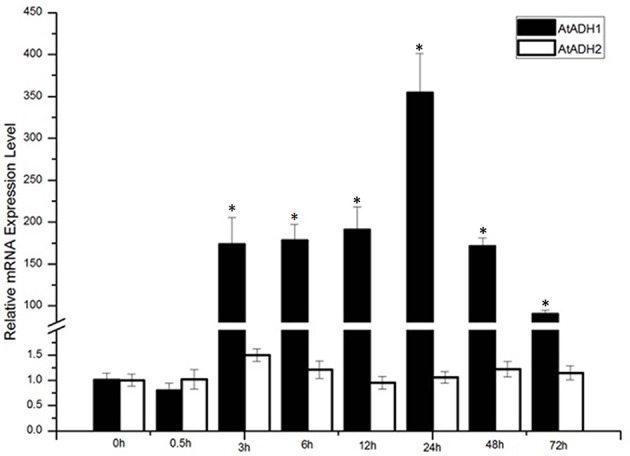
Figure 1.

The expression levels of AtADH1 in response to −4°C cold stress treatments, CbADH1 gene expression induced by cold stress. Conditions for Q-PCR were optimized to show induction relative to basal levels (time 0). The data represented the average of triplicate experiments ± standard deviation (SD). The asterisk indicated significant difference (p < 0.001).
