
Figure 2.
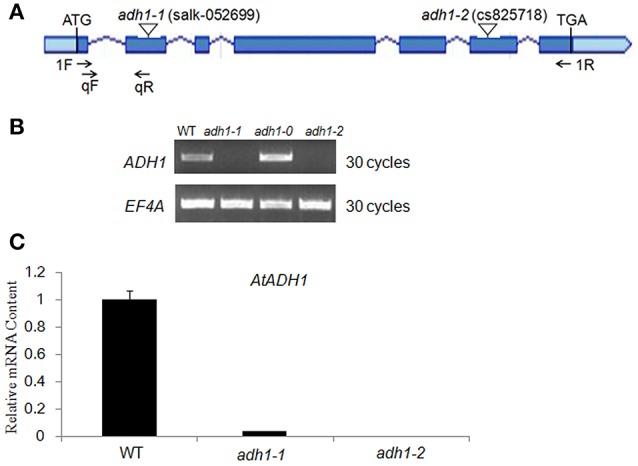
Characterization of adh1 mutants. (A) Schematic diagram showing the positions of the T-DNA insertions or nucleotide changes at the ADH1 locus. Rectangles represent exons. Arrows indicate PCR primers used in genotyping and RT-PCR analysis of T-DNA alleles. (B) Genotyping of adh1 T-DNA alleles. (C) RT-PCR analysis of AtADH1 transcript level in adh1 T-DNA mutants, EF4A as the reference gene.