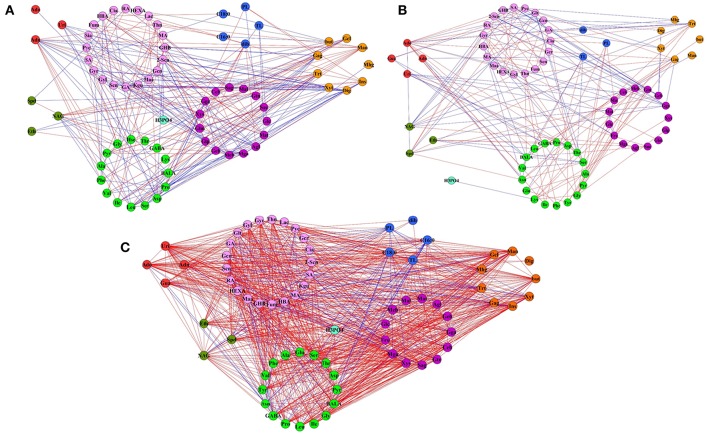
Figure 7.
Metabolite network based on significant correlations in cold treatment samples. Node colors represent different primary metabolites. Green for the amino acid, lavender for organic acid, purple for sugar, red for the nucleotide, brown for the polyol, dark green for the polyamine, blue for the other. Edges between nodes represent correlations identified as significant at |r| > 0.9, FDR < 0.05, where blue edges specific to adh1 and red edges specific to WT. (A) In the control group (always in 23°C). (B) Freezing treatment with cold acclimation (4°C for 7 d, then treated at −6°C for 2 h). (C) Freezing shock without cold acclimation (−6°C for 2 h).

