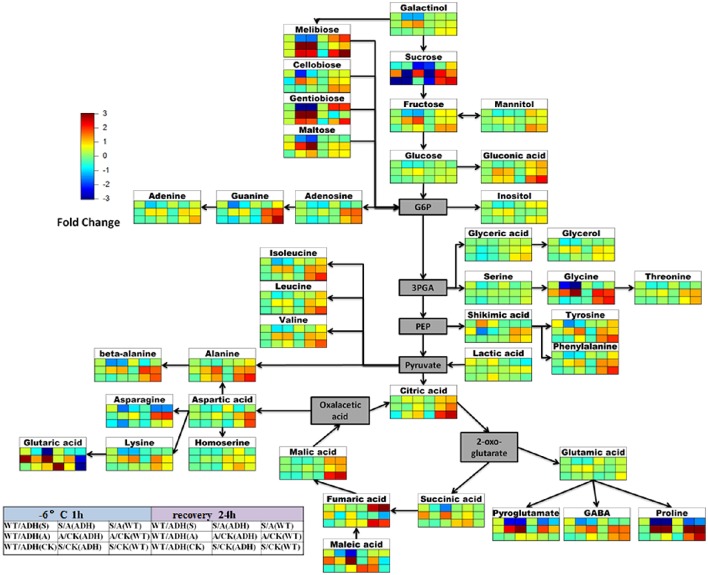
Figure 8.
Scheme of metabolite abundance during cold treatment and recovery. The difference in the high degree of the color is deeper, and differences in the lower level of the color is shallower. Red for rise, blue for down. Color matrix expressed the different fold in metabolite levels respectively at cold treatment 2 h and recovery 24 h between adh1 and WT under the certain condition (CK, the control group 23°C always; S, cold shock −6°C for 2 h; A, cold acclimation 4°C for 7 d, then treated at −6°C for 2 h).

