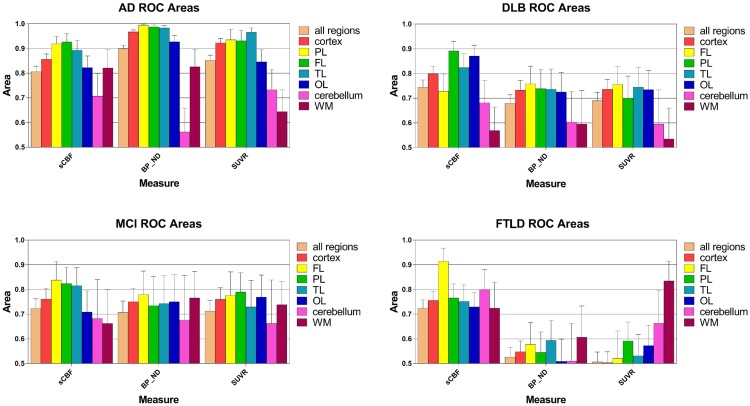
FIGURE 5.
Areas under receiver-operating curves (ROC) for all regions, ±SEM, including cortex, frontal (FL), parietal (PL), temporal (TL), and occipital (OL) lobes as well as cerebellum gray matter and white matter (WM). Each separate graph represents a single diagnostic group (AD, DLB, MCI, FTLD). The integral of the ROC curve is plotted for each variable. Areas close to unity represent a high level of true positives and low level of false negatives, i.e., higher diagnostic certainty. Areas close to 0.5 means that the ROC curve is close to the line of unity at which there is no difference among the distributions of values in the pathological condition and in the group of the HC, i.e., least disease discrimination, as expected for the reference region.

