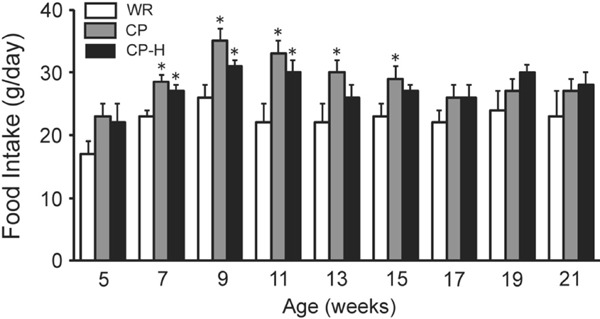
Fig. 2.

Food intake levels of the WR, CP, and CP-H groups at each time point studied
WR, normal rats; CP, metabolic syndrome rats; CP-H, metabolic syndrome rats exposed to mild hyperbaric oxygen for 3 h per day. Values are means ± SD for five animals. *p < 0.05 compared with WR.
