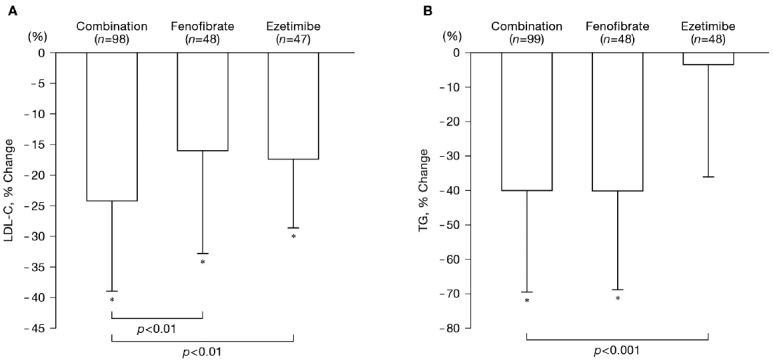
Fig. 2.

Changes in LDL-C and TG during treatment by the study group
The mean value at baseline was defined as the mean of values of week −4 and week 0. Mean value during treatment was calculated as the mean of values of week 12, week 24, and week 52 (or at discontinuation).
*p < 0.05 (vs. Baseline for percent change), by one-sample t-test
p values between treatment groups were single-sided for between-group comparison by two-sample t-test.
LDL-C, low-density lipoprotein cholesterol; TG, triglycerides
