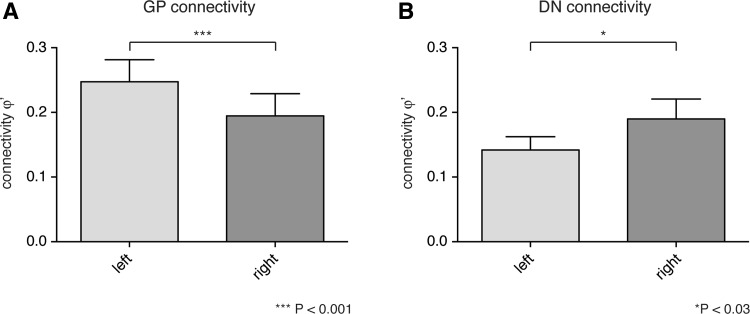
Fig. 3.
Analysis of the hemispheric difference in pallidal and cerebellar connection density within the thalamus. Overall connectivity values (mean ± SEM) were higher from GP to thalamus in the left hemisphere than in the right (a, p < 0.001), whereas projections from right DN into the left hemispheric thalamus were lower compared to connectivity values for projections from left DN into the thalamus of the right hemisphere (b, p < 0.05). All regions that have been considered for the connectional fingerprints (Fig. 2) were included in the analysis

