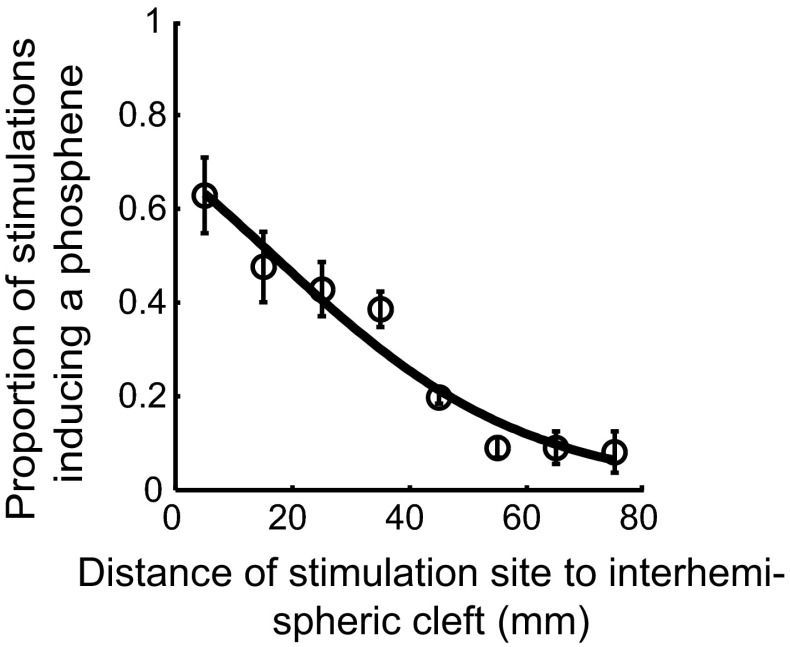
Fig. 3.
Mean proportion of TMS stimulations that induced a phosphene (circles) displayed as a function of the distance from stimulation site to the interhemispheric cleft. Error bars show the variability (SEM) of results for individual participants. A solid line shows the outcome of stimulation predicted for different stimulation locations by a binary logistic regression model that was fitted to the observed data

