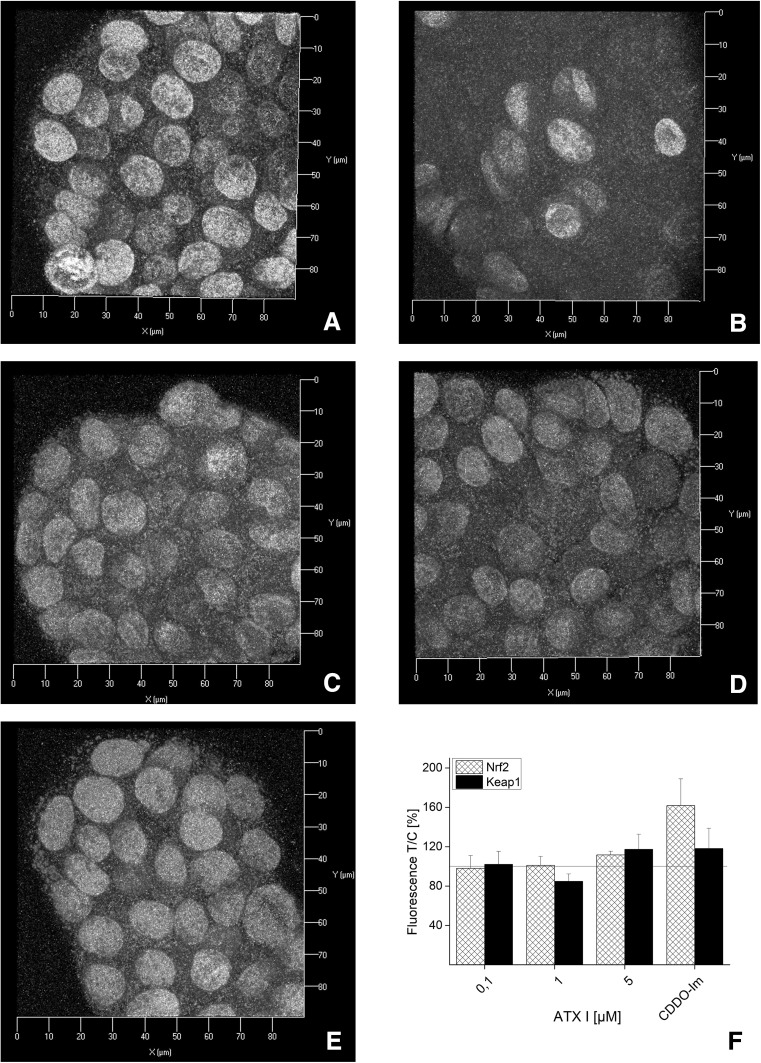
Fig. 3.
Immunofluorescence localization of Nrf2 and Keap1 after 1 h of incubation with ATX I in HT29 cells. Representative images of immunolocalization of Nrf2 (red), Keap-1 (green) and lamin B (gray) after incubation with EtOH (solvent control, a), 0.5 µM CDDO-Im (b), ATX I 0.1 µM (c), 1 µM (d), 5 µM (e). Axes x 0–90 µm, y 0–90 µm. f Quantification of Nrf2 (patterned bars) and Keap1 (black bars) signals in cells incubated with ATX I (0.1, 1 and 5 µM) and CDDO-Im (0.5 µM). Mean values of fluorescence in the optical fields are expressed as percentage of solvent controls ±SEM (n = 3–6 independent experiments) (color figure online)

