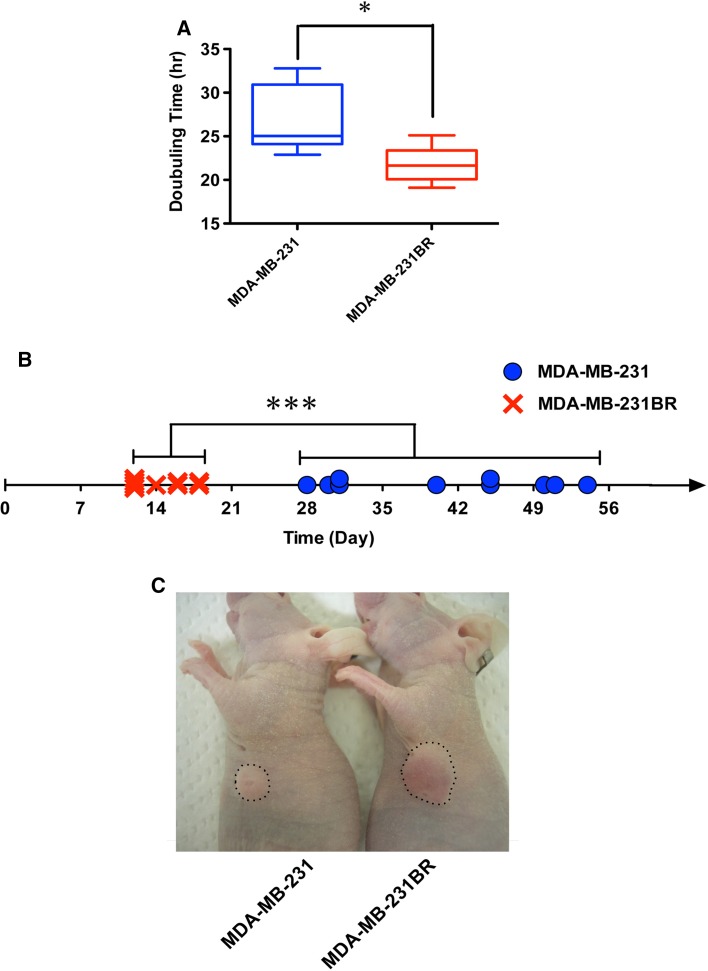
Fig. 1.
In vitro proliferation and in vivo tumor growth of MDA-MB-231 and MDA-MB-231BR. a Doubling time of MDA-MB-231 and MDA-MB-231BR grown in RPMI-1640 with 10% FBS (N = 6). The band within the box represents the median, and the upper and lower whiskers represent the maximum and minimum values, respectively. * P < 0.05. b Days at which the tumors reached a volume of 100 mm3 in individual mice. *** P < 0.001. c Representative mice bearing MDA-MB-231 and MDA-MB-231BR on Day 19

