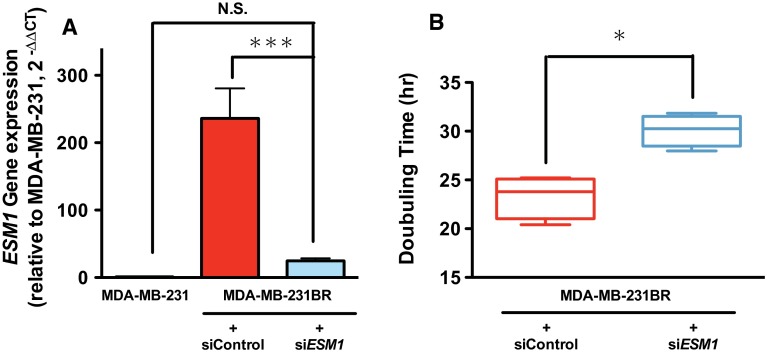
Fig. 3.
Effect of specific knockdown of ESM1 on MDA-MB-231BR. a Changes in gene expressions of ESM1 in MDA-MB-231BR in response to ESM1 siRNA. Gene expression levels were expressed relative to the value in MDA-MB-231 calculated by the method. Data represent the mean with SEM of three independent samples (N.S. No significance; *** P < 0.001). b Doubling time of MDA-MB-231BR treated with control siRNA and ESM1 siRNA when grown in RPMI-1640 with 10% FBS (N = 4). The band within the box represents the median, and the upper and lower whiskers represent the maximum and minimum values, respectively. * P < 0.05

