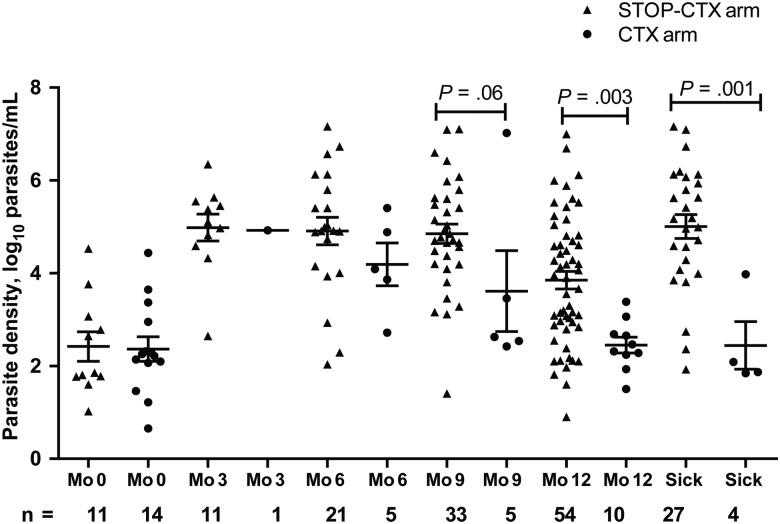
Figure 2.
Scatterplot showing malaria parasite density at enrollment, quarterly visits, and sick visits among patients continuing cotrimoxazole (CTX) therapy (the CTX arm) and those ceasing CTX therapy (the STOP-CTX arm). Data are limited to patients with parasites detected. Triangles represent the STOP-CTX arm, whereas circles represent the CTX arm. At all visits after enrollment, the STOP-CTX arm had more malaria parasite–infected subjects and a higher mean parasite density than those in the CTX arm. Differences in parasite density between arms over the follow-up period was tested using a generalized estimating equations model with identity link, independence working correlation structure, and robust standard errors to handle repeated measures within individuals. Error bars represent means with standard errors of the mean.

